Technical Outlook:
- A rare down day for the market - in the case of SPDR S&P 500 (NYSE:SPY), only its second in the past seven trading sessions. And as we have seen of late, the sell-offs are quite often mitigated by a huge swell of buying into the close that wipes out all of the day's losses (i.e. Nasdaq yesterday) or makes the sell-off barely one at best.
- Strong volume for SPY yesterday considering how weak the volume was last weak and considering this is the first day back from a holiday weekend. Volume came in well above average.
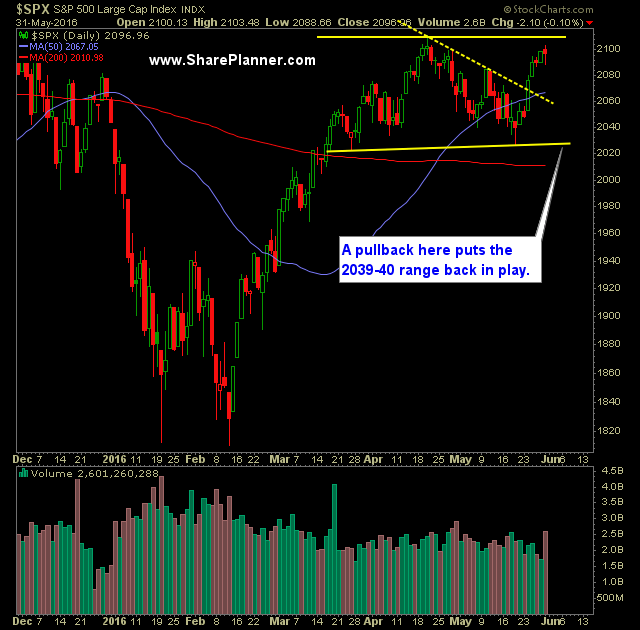
- 5-day moving average held strong for SPX yesterday after testing it and trading slightly below it momentarily.
- This is still a choppy market - yes, the rally over the past week has been solid, but it is not one that you can be comfortable with. As long as price remains between 2040 and 2138, expect price to get whimsical in its direction.
- Inverse head and shoulders pattern exists on the daily chart going back to November of last year. A break above 2111 would confirm the pattern.
- Oil showing a little bit of weakness of late, having pulled back about 3% since having hit the $50/barrel mark.
- Defense sector showing signs of weakness - names including but not limited to: NYSE:NOC, NYSE:BA, NYSE:LMT
- The short-term head and shoulders pattern that we had been following earlier has been nullified, but in the same time frame going back to April, you could make the case that a possible double top is forming if price begins to accelerate to the downside.
- Head fake on the breakout on the 30 minute SPX chart that brought back into consolidation. A move below 2087 could be problematic here.
- Of late, SPX has been riding up the upper band, which is good sign for the market
- The first day of the trading month has been very, very bullish of late leading to some of the year's biggest rallies. The previous three 'first days' have been incredibly bullish.
- You are officially entering into the summer months, where Brexit is a concern and the FOMC is more than likely at some point to raise interest rates.
- The next objective for the market is to push through 2100 and over and above 2111 which would establish a new higher-high on the current trend-line off of the May lows.
- Above 2111 is 2116 and then after that, all-time highs are on watch.
- VIX rallied hard off of the lower 13's which is undoubtedly a concern for SPX here. That is the exact area where numerous sell-offs in stocks have taken place, and the pop in the VIX was to the tune of 8.2% yesterday to 14.19.
- The longer-term head and shoulders pattern on the weekly chart going back two years would be nullified on a move back above 2116.
- There is a lot at play here and a lot of potential to change the scope and shape of the market should this market continue rallying higher.
- 2040-2138 price range on SPX continues to show just how difficult this price range is for trading, and over the last two years the price action has spent its time trading in it.
- I believe at this point, profits have to be taken aggressively, and avoid the tendency to let the profits run - the market is in a very choppy range that has mired stock price for the past two years. Unless it breaks out of it and onto new all-time highs, then taking profits aggressively is absolutely important.
My Trades:
- Added one new short position to the portfolio yesterday.
- Did not close out any positions yesterday.
- Currently 30% Long / 10% Short / 60% Cash
- Remain long: AMZN $709.01, MSFT at $51.74 and one other position
- Will look to add 1-2 new long positions if it appears the bulls will buy the morning weakness. If not, I may add an additional short position to the portfolio.

