
The TJX Companies, Inc. (NYSE:TJX) reported first-quarter fiscal 2018 results, wherein while earnings exceeded expectations, revenues missed the same on the back of disappointing comps growth. Following the results, the company narrowed its fiscal 2018 earnings guidance. Shares fell 4.42% in pre-market trading.
In the reported quarter, earnings of 82 cents per share surpassed the Zacks Consensus Estimate of 79 cents by 3.8%. Earnings also exceeded management’s guidance of 76–78 cents per share. The bottom line grew 7.9% year over year, backed by higher consumer traffic and improved margins. Though management expected currency to hurt earnings by 6%, it had a positive impact on earnings by 1 cent per share.
Quarterly Details
Net sales increased 3% year over year to $7.78 billion, backed by increase in comps and improved traffic. The figure missed the Zacks Consensus Estimate of $7.91 billion by 1.5%. Currency headwinds impacted sales by 2 percentage points.
TJX Companies' consolidated comps grew 1%, but were lower from the 7% comps growth in the year-ago quarter. Higher comps at HomeGoods and TJX Canada increased 3% each, while comps were flat in the Marmaxx and International segment. Comps were in line with the management’s guidance of 0–1% growth.
TJX Companies' consolidated pre-tax profit margin contracted 0.2 percentage points (pp) year over year to 10.7% of sales. Gross margin expanded 0.2 pp year over year to 29.0%. The upside was primarily driven by strong increase in merchandise margins and gains related to the company’s inventory hedges, partially offset by higher supply chain costs.
However, selling, general and administrative costs, as a percentage of sales, went up 0.4 pp to 18.1% due to anticipated increase in wages.
TJX Companies, Inc. (The) Price, Consensus and EPS Surprise
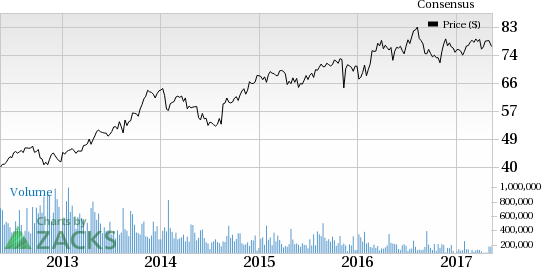
TJX Companies, Inc. (The) Price, Consensus and EPS Surprise | TJX Companies, Inc. (The) Quote
Other Financial Updates
During the first quarter, the company repurchased 4.5 million shares for $350 million. For fiscal 2018, the company continues to expect to repurchase approximately $1.3 billion to $1.8 billion shares. Additionally, the company has announced a 20% increase in dividend in the first quarter, marking the 21st consecutive year of dividend hikes.
Cash and cash equivalents were $2.67 billion as of Apr 29, 2017, while long-term debt was $2.23 billion. Shareholders’ equity was $4.55 billion as of Apr 29.
During the quarter, the company increased its store count by 50 stores to a total of 3,862 stores. It had increased square footage by 4% over the same period last year.
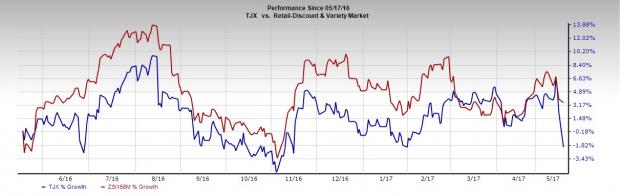
TJX Companies is one of the few retailers that had managed to stay afloat amid troubled waters of the retail sector. In fact, shares of TJX Companies have declined 2.04% since the past one year, underperforming the Zacks categorized Retail – Discount & Variety industry’s gain of 3.51%, which is currently placed at top 42% of the Zacks Classified Industries (110 out of 265).
Q2 Guidance
TJX Companies issued its guidance for second-quarter fiscal 2018. The company expects earnings in the range of 81–83 cents per share compared with 84 cents reported a year ago. Wage increases are expected to negatively impact earnings growth by 2%. Currency headwinds are likely to hurt earnings by 4%. The company expects the change in accounting rules for share-based compensation to positively impact earnings growth by 1%.
For the second quarter, the company expects comps growth of 1–2% over last year’s growth.
Fiscal 2018 Guidance Narrowed
For fiscal 2018, TJX Companies has narrowed its earnings guidance. The company now projects adjusted earnings per share in the range of $3.71–$3.78, compared with the prior-range of $3.69–$3.78. The adjusted guidance (excludes benefit of 11 cents from the 53rd week in fiscal 2018) would represent a 5–7% increase from fiscal 2017 adjusted results of $3.53 per share. Comps are also expected to grow 1–2% for fiscal 2018.
TJX's disappointing result follows dismal results from retailers including Macy's Inc. (NYSE:M) and J.C. Penney Co Inc. (NYSE:JCP) that reported sluggish sales last week, as they struggled to attract customers amid tough retail conditions and a shift to online shopping.
Zacks Rank & Key Picks
TJX Companies currently carries a Zacks Rank #3 (Hold). A better-ranked stock in the retail sector includes Rocky Brands, Inc. (NASDAQ:RCKY) , which sport a Zacks Rank #1 (Strong Buy) and posted a positive surprise of 42.9% in the preceding quarter. You can see the complete list of today’s Zacks #1 Rank stocks here.
5 Trades Could Profit "Big-League" from Trump Policies
If the stocks above spark your interest, wait until you look into companies primed to make substantial gains from Washington's changing course.
Today Zacks reveals 5 tickers that could benefit from new trends like streamlined drug approvals, tariffs, lower taxes, higher interest rates, and spending surges in defense and infrastructure. See these buy recommendations now >>
TJX Companies, Inc. (The) (TJX): Free Stock Analysis Report
Macy's Inc (M): Free Stock Analysis Report
J.C. Penney Company, Inc. Holding Company (JCP): Free Stock Analysis Report
Rocky Brands, Inc. (RCKY): Free Stock Analysis Report
Original post
Zacks Investment Research