Get 40% Off
💰 Buffett reveals a $6.7B stake in Chubb. Copy the full portfolio for FREE with InvestingPro’s Stock Ideas toolCopy Portfolio

Core Indicators Positive, S&P 500 Ready For Clean Break Above 2500

Published 10/01/2017, 02:09 AM
Updated 07/09/2023, 06:31 AM
US500
-
SPXEW1
-

Over the past week, my core market health indicators mostly improved. Most significant is that my measures of market strength have now moved above zero. This changes the core portfolio allocations as follows:

Long / Cash portfolio: 100% long

Long / Short portfolio: 100% long high beta stocks

Volatility Hedged portfolio: 100% long since 11/11/2016
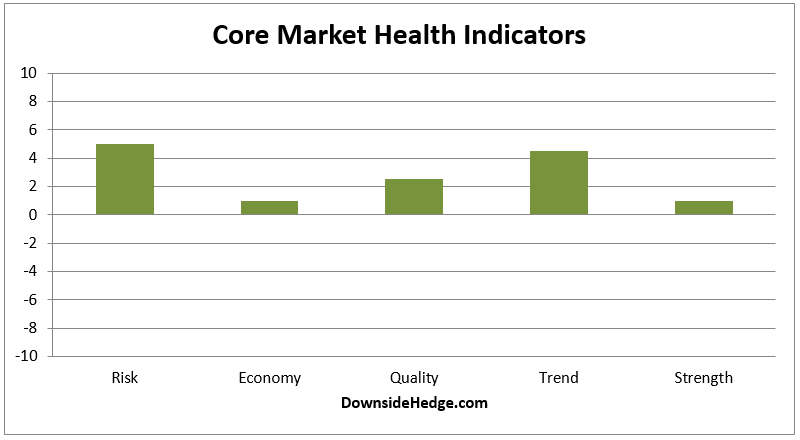
Core market Health Indicators

Another thing of note is that we’ve been seeing broad based buying of the stocks in the S&P 500 Index (SPX) again. If the ratio between the S&P 500 Equal Weighted and SPX can get back above its 20 week moving average it will be a very healthy sign. Since the first of the year, investors have favored mega cap stocks. We want to see the smaller stocks in SPX rallying faster than the mega caps as it will indicate broad based buying and increased tolerance for risk. Add to that, SPX looks like it’s now got a clear break above 2500 and we’ve got the recipe for a rally.
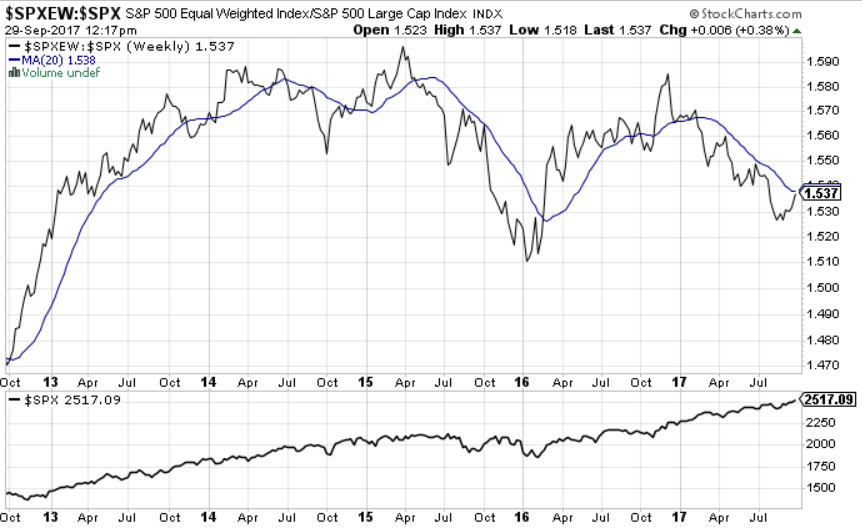
SPXEW SPX Weekly Chart

Conclusion

It looks like we’ve got everything we need for the next leg of this bull market. All of my core indicators are positive, wide spread buying has returned, and SPX has a clean break above 2500. Enjoy the ride.

Latest comments

That's probably means it's time for it to drop
Risk Disclosure: Trading in financial instruments and/or cryptocurrencies involves high risks including the risk of losing some, or all, of your investment amount, and may not be suitable for all investors. Prices of cryptocurrencies are extremely volatile and may be affected by external factors such as financial, regulatory or political events. Trading on margin increases the financial risks.
Before deciding to trade in financial instrument or cryptocurrencies you should be fully informed of the risks and costs associated with trading the financial markets, carefully consider your investment objectives, level of experience, and risk appetite, and seek professional advice where needed.
Fusion Media would like to remind you that the data contained in this website is not necessarily real-time nor accurate. The data and prices on the website are not necessarily provided by any market or exchange, but may be provided by market makers, and so prices may not be accurate and may differ from the actual price at any given market, meaning prices are indicative and not appropriate for trading purposes. Fusion Media and any provider of the data contained in this website will not accept liability for any loss or damage as a result of your trading, or your reliance on the information contained within this website.
It is prohibited to use, store, reproduce, display, modify, transmit or distribute the data contained in this website without the explicit prior written permission of Fusion Media and/or the data provider. All intellectual property rights are reserved by the providers and/or the exchange providing the data contained in this website.
Fusion Media may be compensated by the advertisers that appear on the website, based on your interaction with the advertisements or advertisers.
© 2007-2024 - Fusion Media Limited. All Rights Reserved.