Almost every month, some subset of the class of investors and journalists expresses extreme alarm when the VIX magically plummets on the Monday before the standard monthly options expiration that occurs on the third Friday of every month.
I have written about this before, notably in:
The executive summary is that for most of its monthly cycle the VIX is an interpolated value derived from the first and second month S&P 500 index (SPX) options contracts. In an interpolation, one is presented with two values and attempts to derive a value that is in between those two, typically by drawing a straight line between the values and attempting to determine where on that line the desired value should fall. When one wants to derive a 30-day VIX and the SPX options contracts are, say, 17 and 45 days out, then a simple linear interpolation accomplishes that goal – and that is what the VIX calculation methodology does.
Things become more interesting due to the fact that the CBOE mandates that the near-term month used in the VIX calculation have at least one week to expiration. So what happens is that on Friday the VIX used the March and April expirations in the VIX calculation; today April becomes the near-term month and May becomes the far-term month. With the April expiration falling on April 19th and the May expiration on May 17th, this means the two months used in the VIX calculation have 39 and 67 days until expiration, respectively. So how does the CBOE arrive at a 30-day VIX value? Well, they still use the near-term VIX calculation (VIN) and far-term VIX calculation (VIF), but they accomplish this task by using a negative coefficient for the weighting of the far-term value, in addition to a coefficient that is greater than 100% for the near-term value.
There is nothing wrong with this approach and it delivers reasonable numbers when the near-term and far-term VIX have roughly the same value, but when there is steep contango in the SPX options term structure, which has frequently been the case over the course of the past two years, the resulting VIX calculation can be dramatically lower than both VIN and VIF. Right now, for instance, the VIX is at 11.71, while VIN is 12.48 and VIF is 13.50.
My suggestion would be not to focus too much attention on the VIX while the calculation uses a negative coefficient for VIF, which will be for the remainder of this week. Instead, those looking for a better gauge of what the VIX is should probably focus on VIN for the next four days.
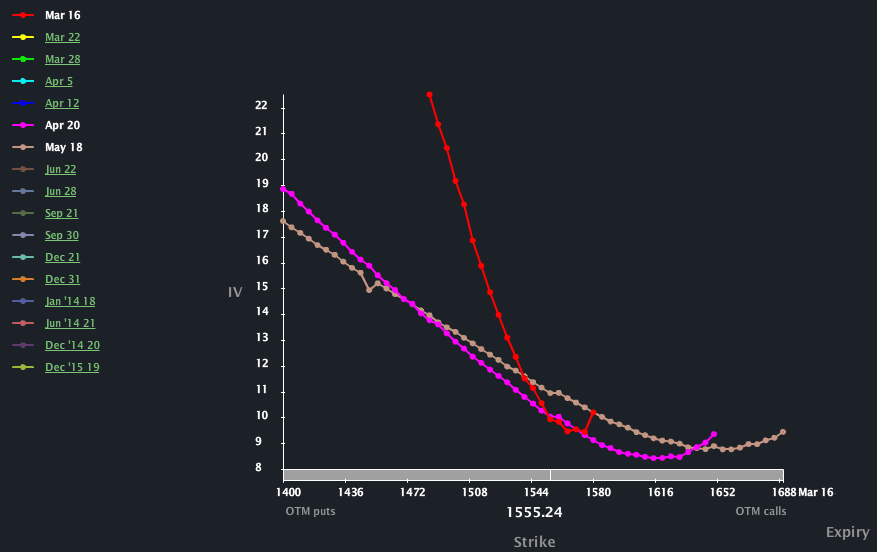
Alternatively, one can refer to SPX implied volatility calculations provided by their options data provider, such as are incorporated into the SPX skew graphic below, courtesy of LivevolPro. 
Disclosure(s): Livevol and the CBOE are advertisers on VIX and More
