The U.S. Government’s massive one-day debt increase had a profound impact on the amount of money it will have to fork over just to service its interest payment. On Friday, Sept 9th, the U.S. Treasury increased the total debt by a stunning $318 billion. Thus, the total U.S. Government debt increased from $19.84 trillion on Thursday to $20.16 trillion on Friday.
We must remember when the U.S Treasury adds more debt to its balance sheet; the government is now obligated to pay additional funds to service the interest on that debt. So, for each increase in U.S. Government debt, comes with it, an increase in its debt service payment.
However, the U.S. Government has been able to control the rise in its annual interest payments by pushing the interest rate lower. For example, the average interest rate on U.S. Treasury debt in 2000 was 6.4% versus 2.2% currently. If we look at the chart below, we can see how the interest rate has declined as U.S. Government debt increased:
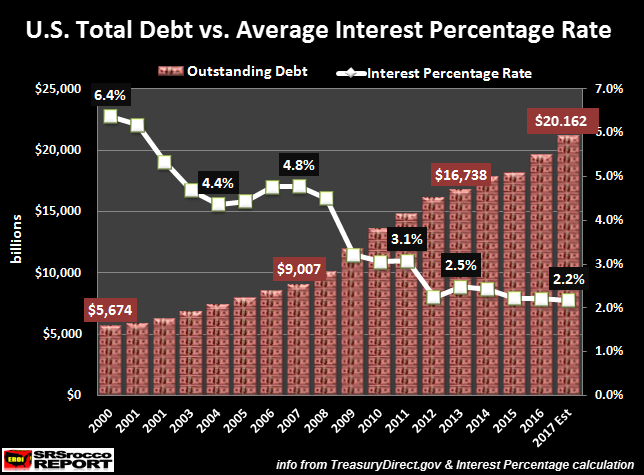
The RED DOLLAR bars represent total U.S. Government debt in billions of Dollars, while the WHITE LINE shows the annual average debt service interest rate. We can plainly see that total U.S. debt has nearly quadrupled from $5.6 trillion in 2000 to $20.1 trillion in 2017.
NOTE: I arrived at the average interest rate percentage figures by dividing the annual interest payments by the total outstanding debt.
This next chart from the Treasurydirect.gov website lists the annual U.S. debt service interest payments:
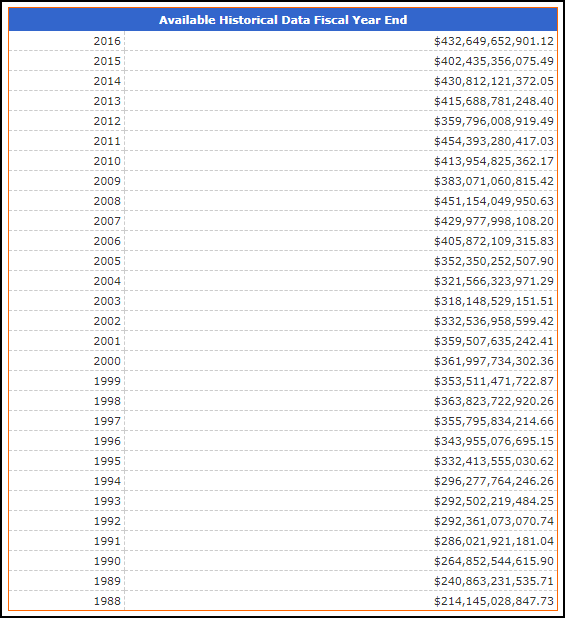
(interest expense on debt outstanding, Treasurydirect.gov)
By taking the interest payment of $362 billion in 2000 and dividing it by the total U.S. Government debt of $5,674 billion ($5.67 trillion), it equaled 6.4%. So, the U.S. Treasury paid an average 6.4% interest payment on its outstanding debt that year.
What is interesting about the figures in the table above is that the U.S. Treasury paid out a larger interest payment in 2008 of $451 billion versus $432 billion in 2016, even though the debt was much higher in 2016. The reason the interest payment was higher in 2008 than in 2016 had to do with a 4.5% interest rate on $10 trillion of debt compared to a 2.2% interest rate on $19.6 trillion in debt. By cutting the interest rate in half (4.5% down to 2.2%), the U.S. Treasury’s interest expense remained flat or slightly declined as the debt nearly doubled.
Skyrocketing Central Bank debt is the rationale behind the super-low or zero interest rate policy. If interest rates were normalized to either a 5-6% rate, the interest payments Central Banks would have to pay would bankrupt them. Unfortunately, this game of suppressing rates to hold down ballooning interest payments will not last forever. Even with a 2.2% average interest rate, the U.S. Treasury will likely reach a new record interest expense in 2017 at an estimated $460 billion:
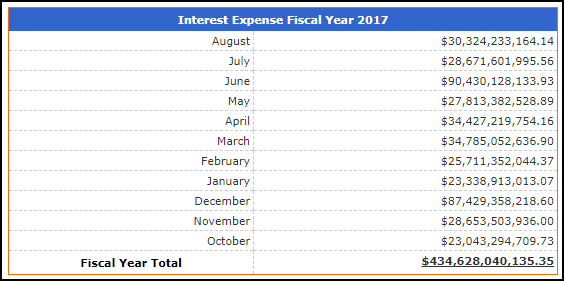
(monthly interest payments, Treasrydirect.gov)
According to the Treasurydirect.gov website, the U.S. Government has paid $434.6 billion in interest payments in 2017, with September remaining. If the September interest payment is $26 billion, the total will reach a record high of $460 billion in Fiscal 2017. So, the notion that the Fed is going to raise rates is pure folly when we realize it will severely push up the U.S interest payment on its debt.
What would happen to the annual U.S. interest payment if the average rate was the same as in 2000 at 6.4%? Good question. The following chart provides the answer:
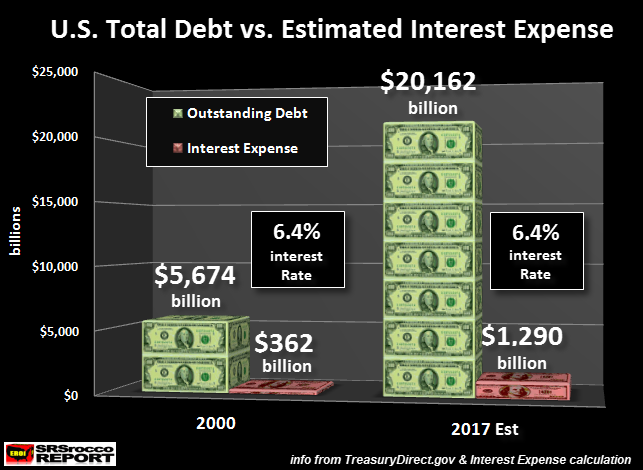
If the average interest rate increased to 6.4%, the U.S. Treasury annual service on its $20.1 trillion in debt would surge to $1.3 trillion, nearly three times larger than the $460 billion it will pay this year. That is a BIG NUMBER.
There is no way the U.S. Government will allow the interest rates to rise as it is already dealing with a $566 billion budget deficit for the first ten months of 2017 (source). If interest rates raised just to a typical 5%, that would push the U.S. interest payment up above $1 trillion. This would more than double the budget deficit to over $1.1 trillion a year.
The Fed and Central Banks only have one way to go, and that is increasing debt levels and lower interest rates. If they do not continue with that policy, then the entire financial system comes crashing down… and DOWN IT WILL.
To give you an idea just how insane the ONE-DAY $318 billion increase in U.S. debt is on its annual interest payment, take a look at the chart below:
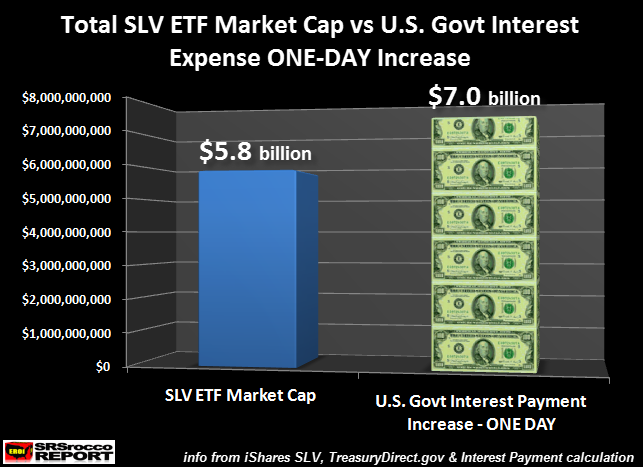
The U.S. Treasury will have to pay out an additional $7 billion interest payment for the extra $318 billion in debt it increased in just one day. Again, that $7 billion interest payment is based on an average 2.2% rate multiplied by the $318 billion in debt. Now, if we compare the additional $7 billion of U.S. interest expense to the total value of the silver iShares Silver (NYSE:SLV) ETF of $5.8 billion, we can plainly see that printing money, and increasing debt becomes a valuable tool for Central Banks to cap the silver price.
By the U.S. Treasury issuing another $318 billion in debt and another $7 billion on top of that in interest payments, this should have some impact on the precious metals prices, but it doesn’t. How can the U.S. Government increase its debt in one day by an amount that would purchase all above ground silver investment inventories six times over, and not even impact its price???
That’s correct. The total 2.6 billion oz of physical silver investment in the world is currently valued at $52 billion (2.6 billion oz X $20). Thus, the ONE-DAY $318 billion U.S. debt increase would consume over 15 billion oz of silver at $20 an ounce.
So, why does the U.S. Treasury continue to increase its overall debt and interest payments? Because it’s in the best interest of the U.S. Treasury to prop up the 99% of Americans who are invested in the markets. Also, the U.S. local, state and federal governments receive taxes on salaries, real estate, businesses, investments, etc. If the markets crashed, so would U.S. government tax revenues. Thus, the U.S. Government would collapse along with the markets as asset prices imploded.
Lastly, the precious metals are one of the best safe havens to be in when the Fed and Central Banks lose control of propping up the markets. Unfortunately, 99% of Americans will find about gold and silver a day late and a dollar short.
HOW TO SUPPORT THE SRSROCCO REPORT SITE:
UPDATE: It seems as if many of my followers enjoyed my last two articles as several became new members on the site as well as SRSrocco Report Patrons. I want to personally thank everyone who decided to support the SRSrocco Report site over the past week.
