It was a holiday shortened trading day in the U.S., but it was enough time to deliver a bit of relief for the U.S. dollar index (DXY0).
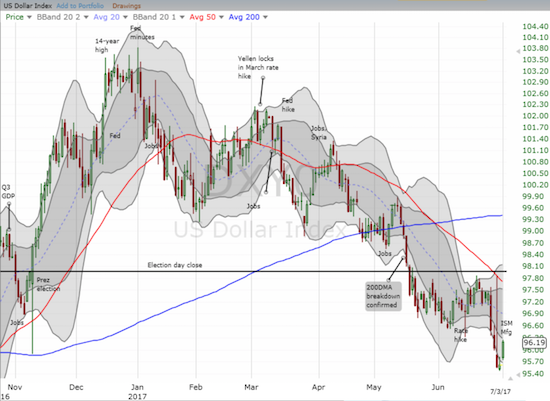
The U.S. dollar index (DXY0) bounced sharply off a 9-month low.
The most significant move for the U.S. dollar was against the ever-weakening Japanese yen (NYSE:FXY). USD/JPY broke out and stayed above resistance at its uptrending 200-day moving average (DMA).
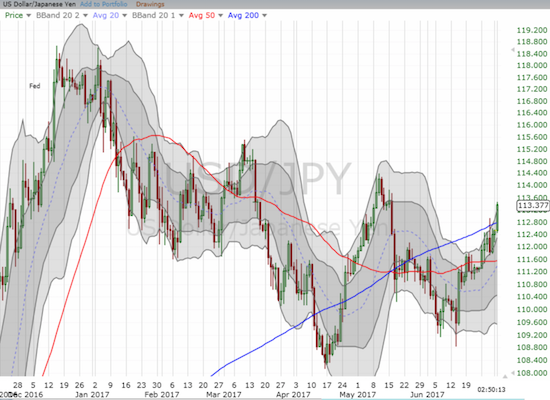
The U.S. dollar hurdled over 200DMA resistance against the Japanese yen. The May high for USD/JPY should get tested.
However, I most like playing the U.S. dollar against the Canadian dollar (NYSE:FXC) for a short-term relief bounce. Oil has had a sharp surge from recent lows, so “gravity” alone should soon generate some kind of pullback. That pullback should further boost USD/CAD.
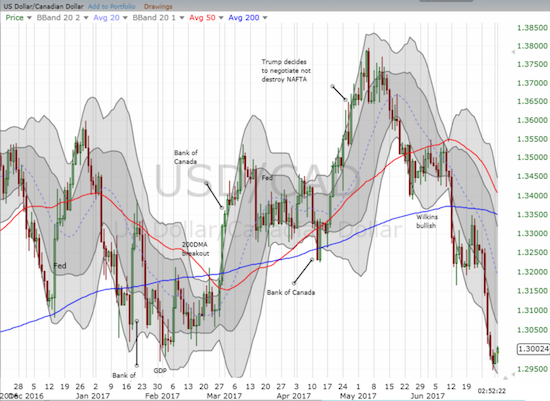
The Canadian dollar has really slammed the U.S. dollar lately. Comeback time for USD/CAD.
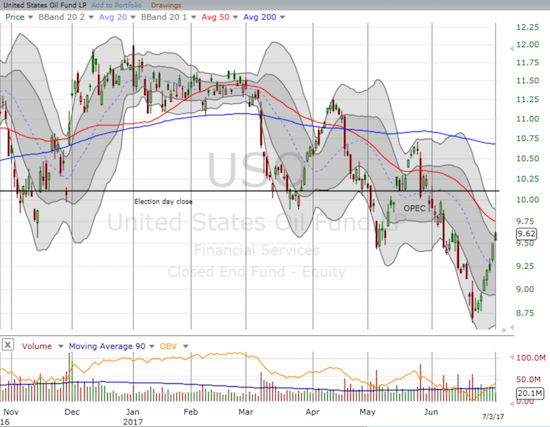
A sharp relief rally in oil prices has propelled the United States Oil Fund (NYSE:USO) to a 10% gain in less than 2 weeks.
Here is what the ISM reported (emphasis mine):
“The June PMI® registered 57.8 percent, an increase of 2.9 percentage points from the May reading of 54.9 percent. The New Orders Index registered 63.5 percent, an increase of 4 percentage points from the May reading of 59.5 percent. The Production Index registered 62.4 percent, a 5.3 percentage point increase compared to the May reading of 57.1 percent. The Employment Index registered 57.2 percent, an increase of 3.7 percentage points from the May reading of 53.5 percent. The Supplier Deliveries index registered 57 percent, a 3.9 percentage point increase from the May reading of 53.1 percent. The Inventories Index registered 49 percent, a decrease of 2.5 percentage points from the May reading of 51.5 percent. The Prices Index registered 55 percent in June, a decrease of 5.5 percentage points from the May reading of 60.5 percent, indicating higher raw materials’ prices for the 16th consecutive month, but at a slower rate of increase in June compared with May. Comments from the panel generally reflect expanding business conditions; with new orders, production, employment, backlog and exports all growing in June compared to May and with supplier deliveries and inventories struggling to keep up with the production pace.“
The ISM also noted that the economy grew for the 97th straight month.
I trust that it was indeed strong economic data that drove the action because U.S. Treasury yields increased again. For example, the iShares 20+ Year Treasury Bond ETF (NASDAQ:TLT) dropped to critical support at converged 50 and 200DMAs. My low ball order to add to my TLT call options did not fill thanks to the small bounce off support.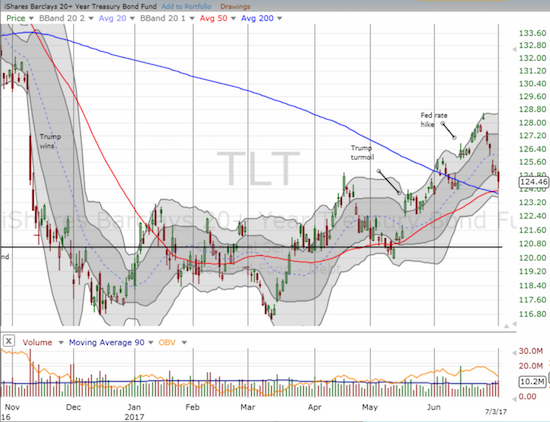
The iShares 20+ Year Treasury Bond ETF (TLT) neatly tested converged 50/200DMA support and bounced.
It is interesting to see again, finally, U.S. dollar strength alongside higher rates. Let’s see how long either one lasts…
Be careful out there!
Full disclosure: long USD/CAD, long TLT call options, short USO put options
