S&P 500 (SPY)
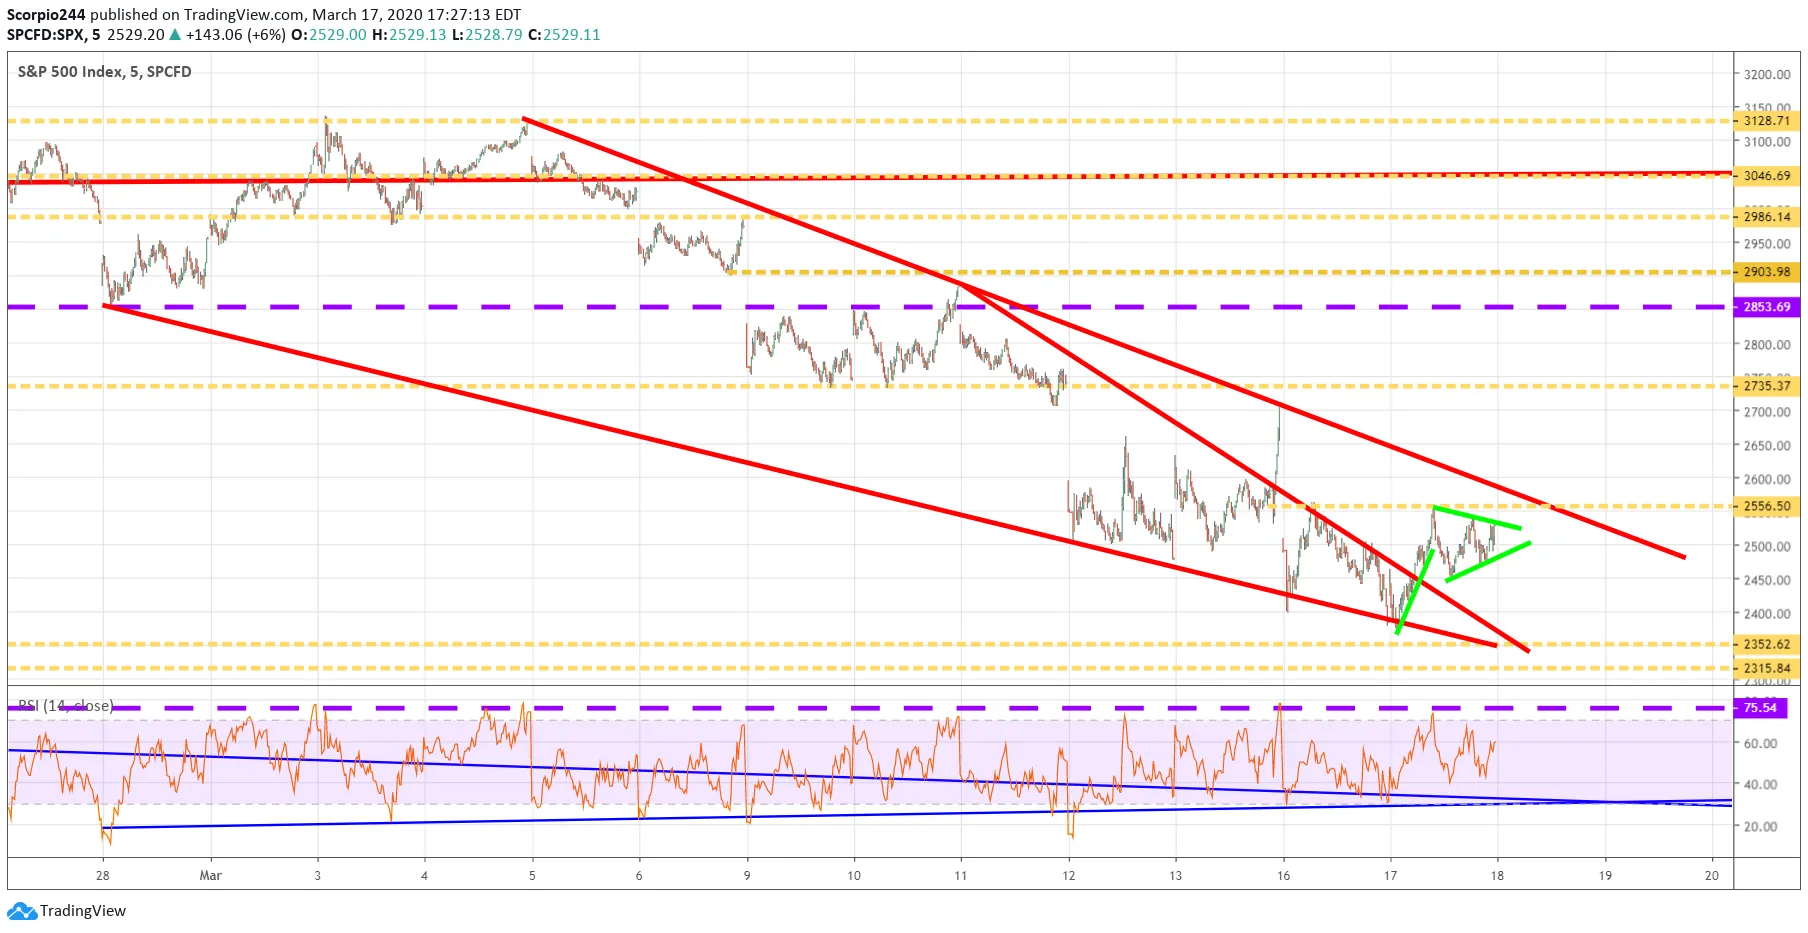
As the S&P 500 approached the December 2018 lows, suddenly, it stopped. The tides turned, parting the seas, and then, there was light, and a path higher emerged.
The S&P 500 started on rocky ground falling to as low 2,367 and putting the index just 10 points above the December 2018 lows. It was close; I could certainly feel my heart pumping as I saw the numbers draw closer and closer. Somehow, and for some reason, it just stopped at that 2,367. It was precisely a 30.25% pull back from the peak at that point. Was 30% the magic mark? Who knows, and who cares.
It was all up from that point, and there was even this little bull pennant pattern that formed by days end in the S&P 500. Couple that with the index moving higher and breaking free of a falling wedge, it seems there is a good chance we might even have two positive days in a row.
Now, the S&P 500 faces a really tough level of resistance around 2,550 and then again at the downtrend in a range of 2,560 to 2,580. Break that downtrend, and we have some serious room to start moving higher towards 2,700.
Of course, fail, and well, that means we go right back to testing the lows around 2,370, and maybe even 2,350. Let’s hope that we move up.
We will have our answer one way or another by 12:45, that is when the downtrend and resistance converge.
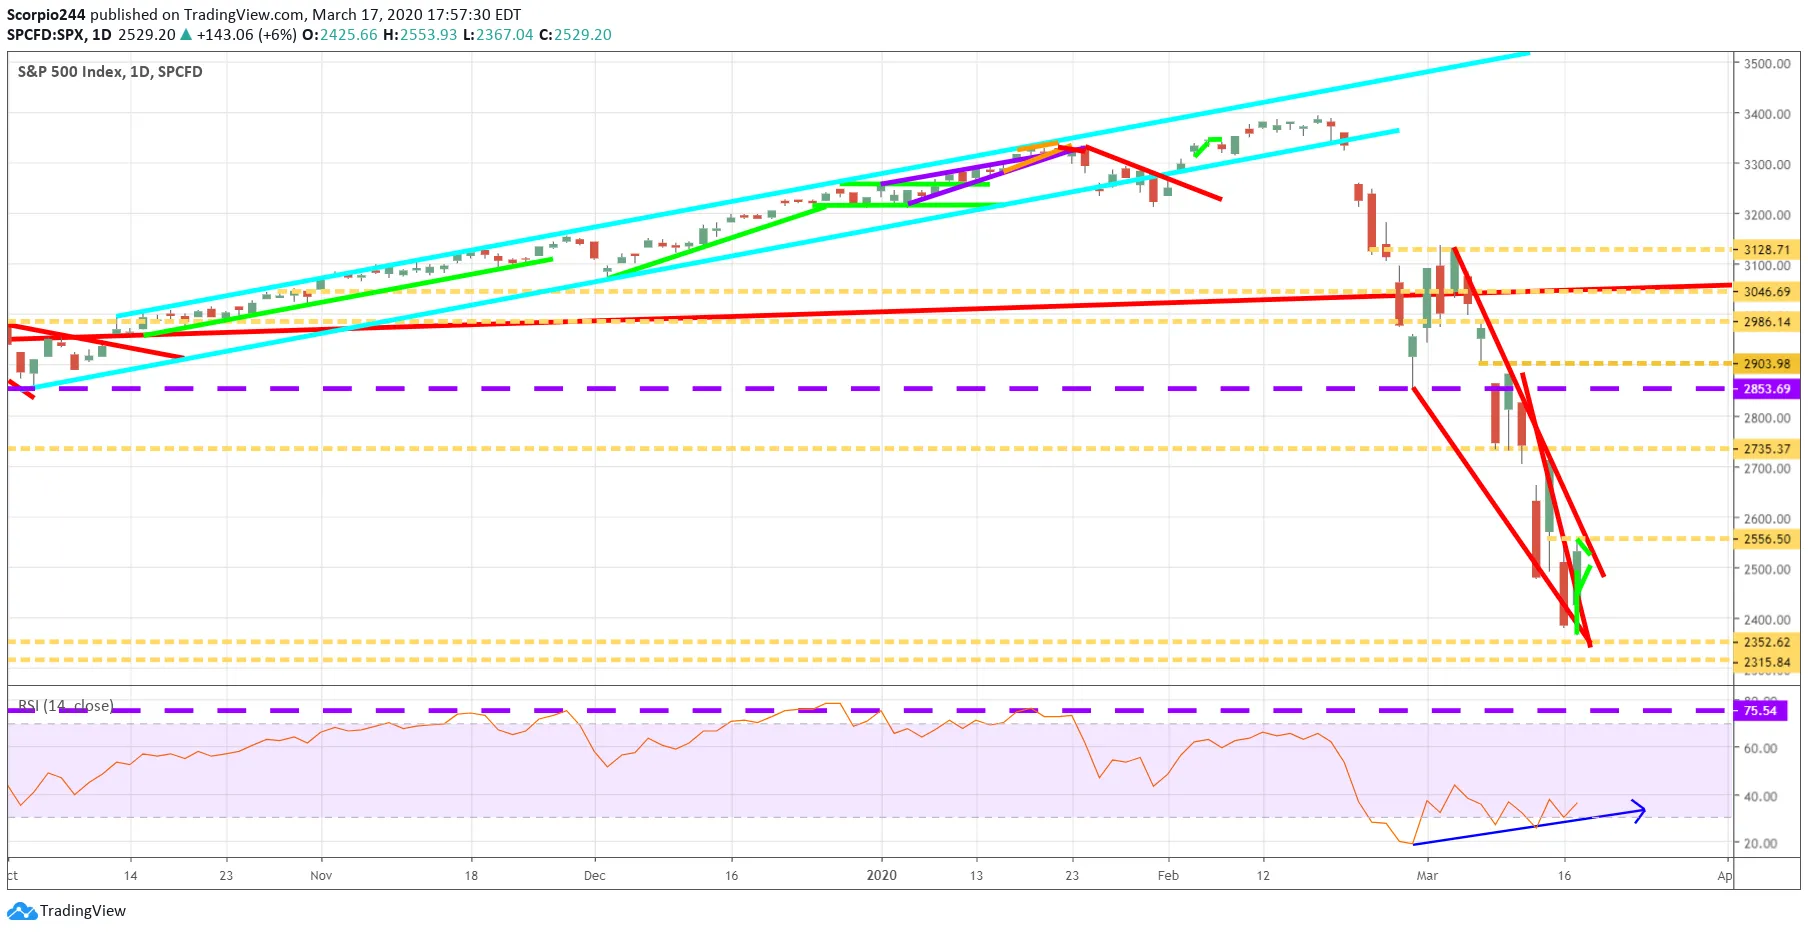
Again, the RSI is also trending higher, and once again pointing to a change in trend, and the S&P 500 pushing higher from here.
Russell 2000 (IWM)
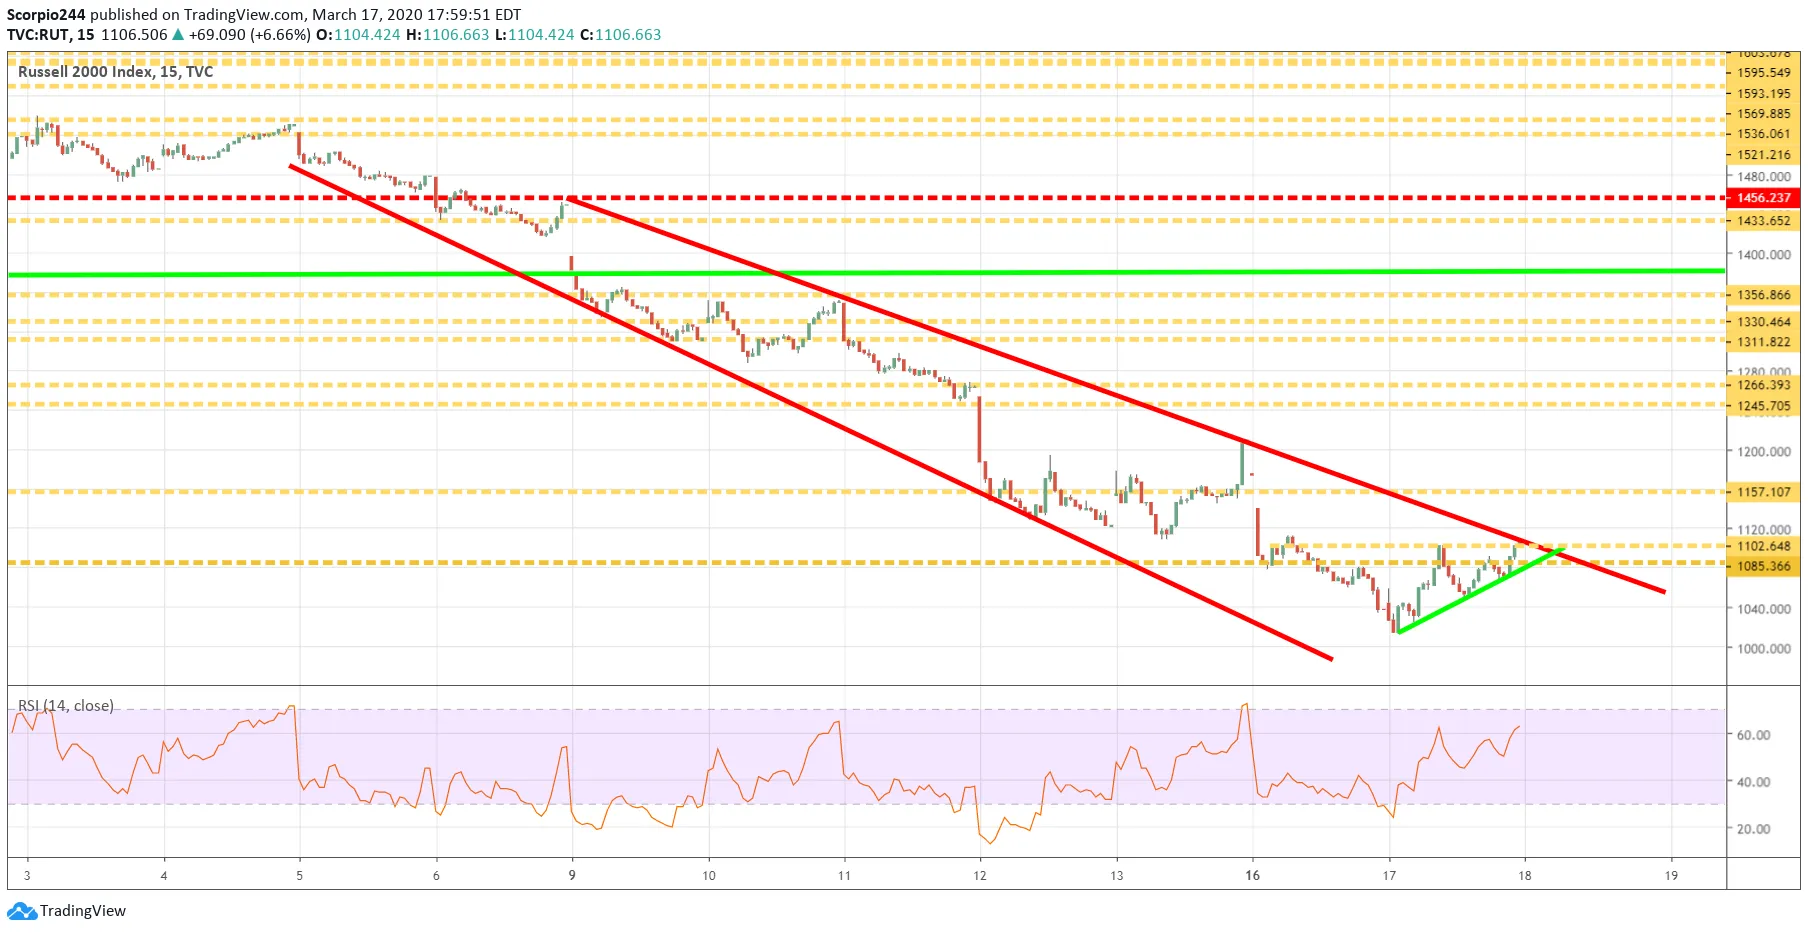
The Russell 2000, may have formed its first uptrend in this entire disaster. A push above 1,110, and we can start dreaming about 1,150 and then 1,200.
10-Year (TLT)
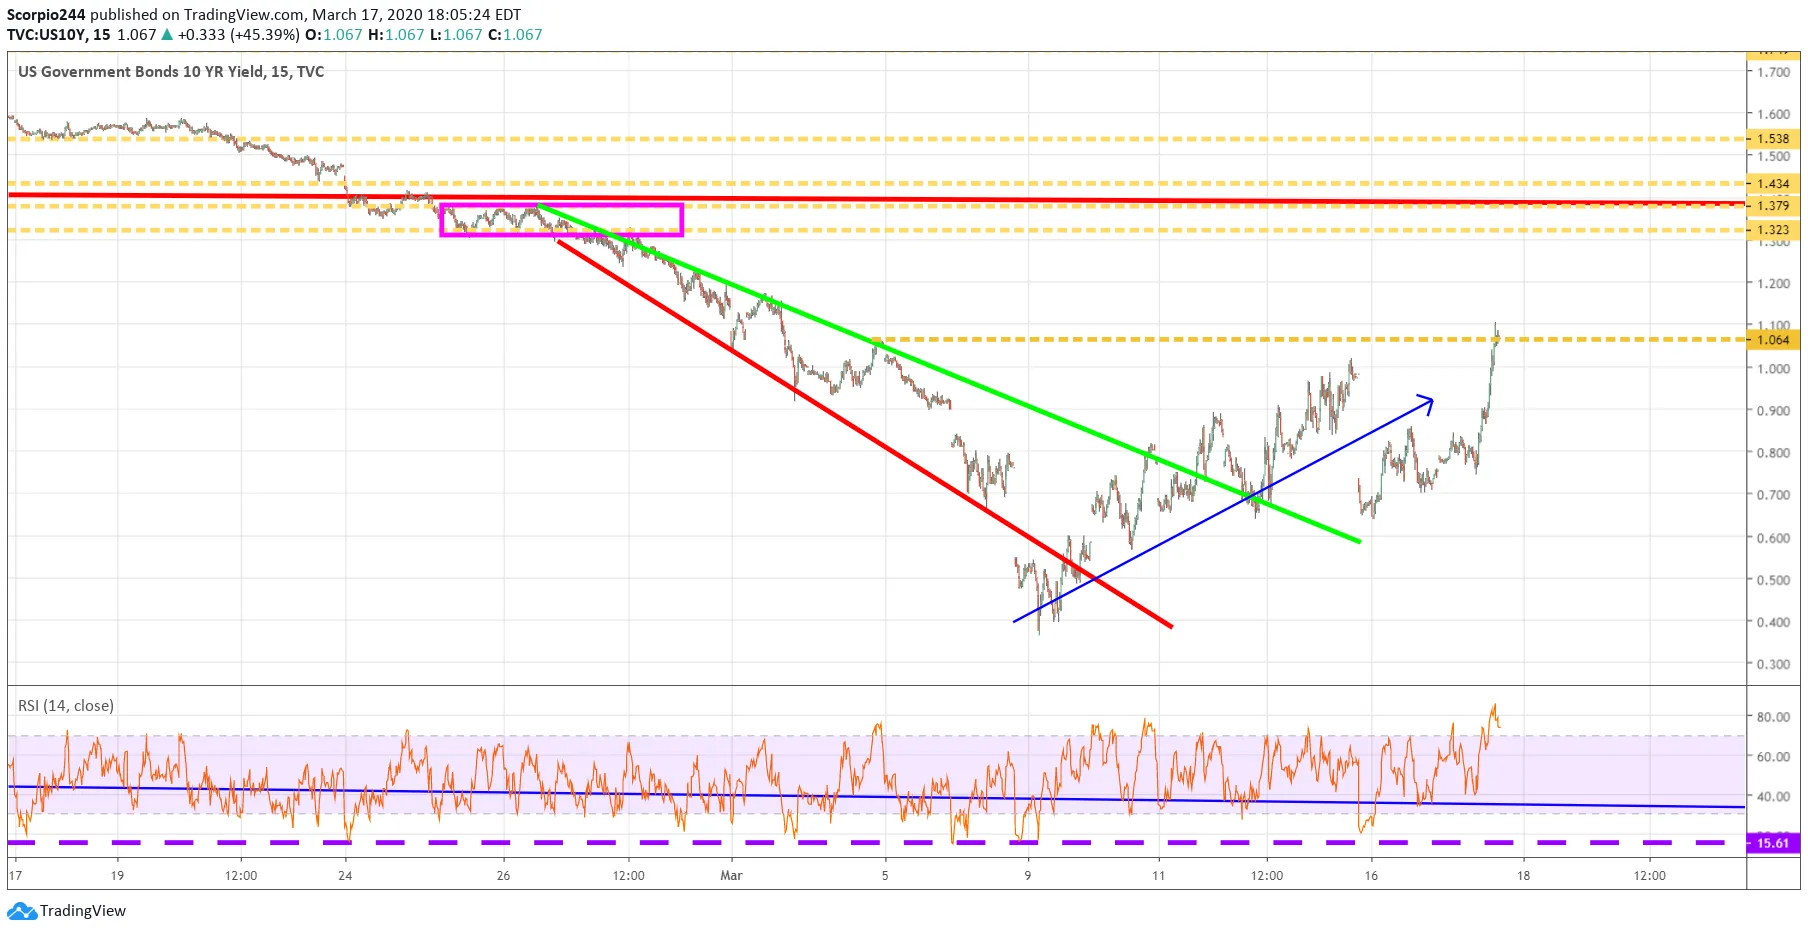
The 10-year had a massive move higher yesterday, rising to our target of 1.06%. I wouldn’t be surprised to see the 10-year back up at 1.32% in the not to distance future, especially with all the stimulus coming, the budget deficit is going to be enormous this year.
VIX
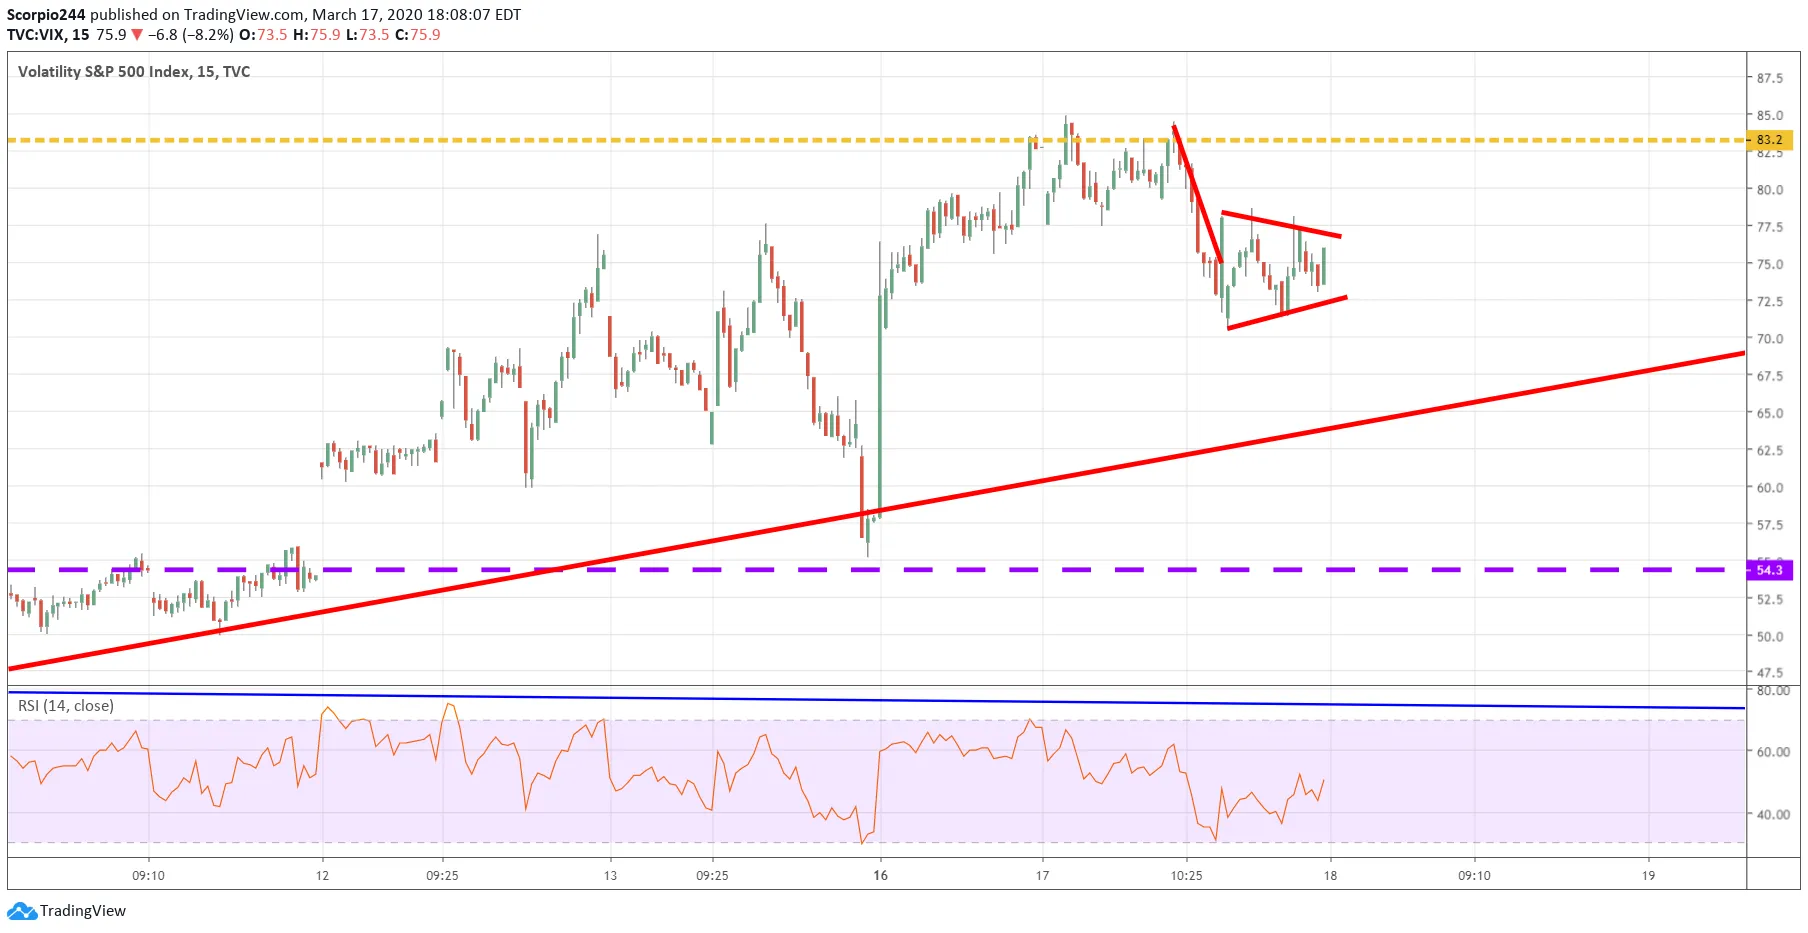
The VIX may be forming a bear flag, and that means we should be testing the uptrend, probably today, with a break of that trend sending the VIX back to 54. I noticed some bearish betting in the VIX options again yesterday.
Apple (AAPL)
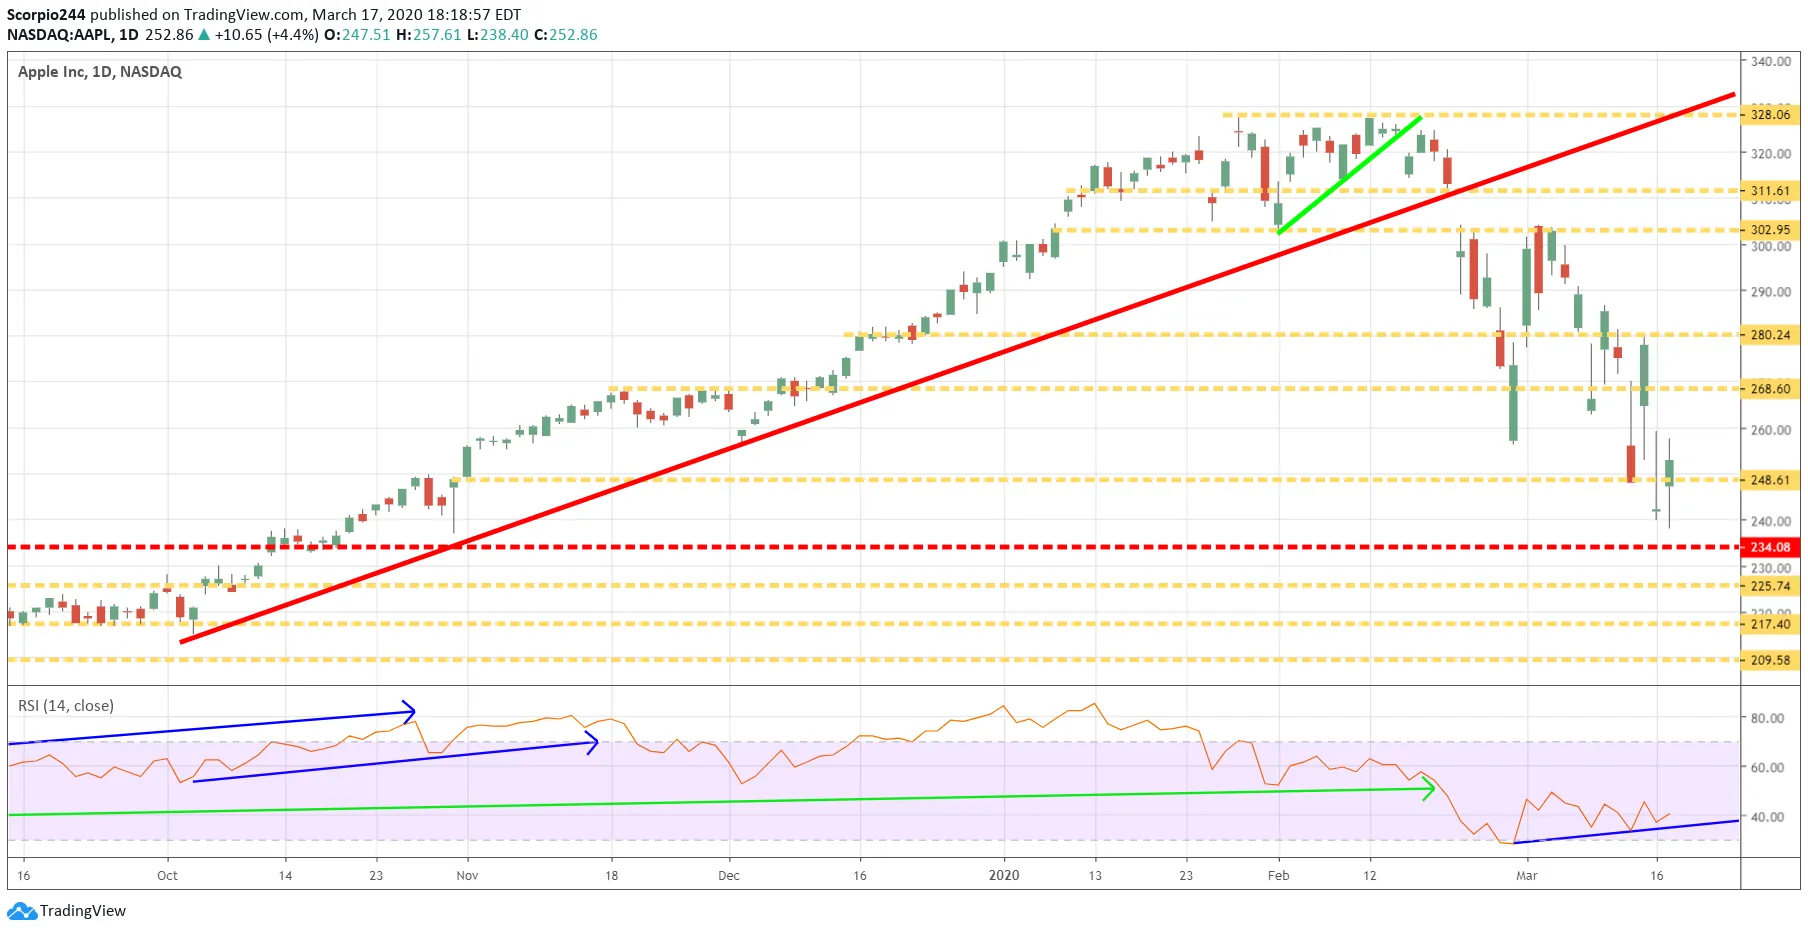
The RSI for Apple (NASDAQ:AAPL) continues to point to a change in trend and reversal higher to come, with the next level of resistance at $268.
Mastercard (MA)
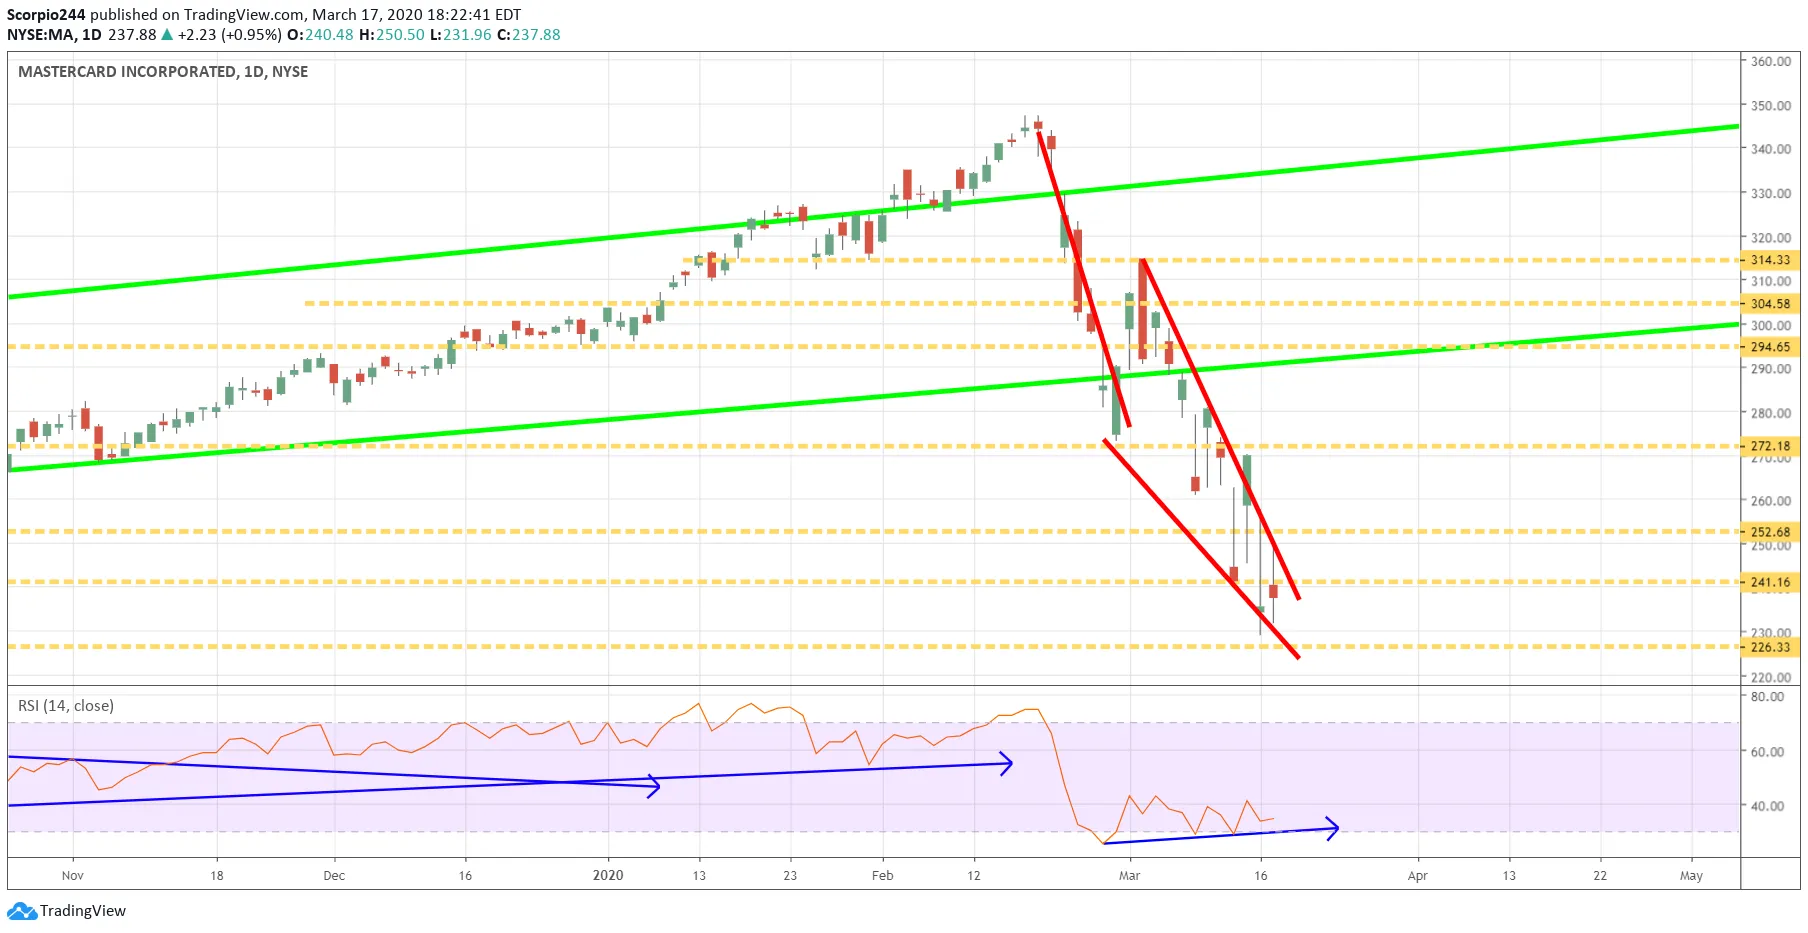
Mastercard (NYSE:MA) has this giant falling wedge pattern as well, and the RSI is also signaling a bottoming pattern with room for the stock to rise to $252, then $275.
Zoom (ZM)
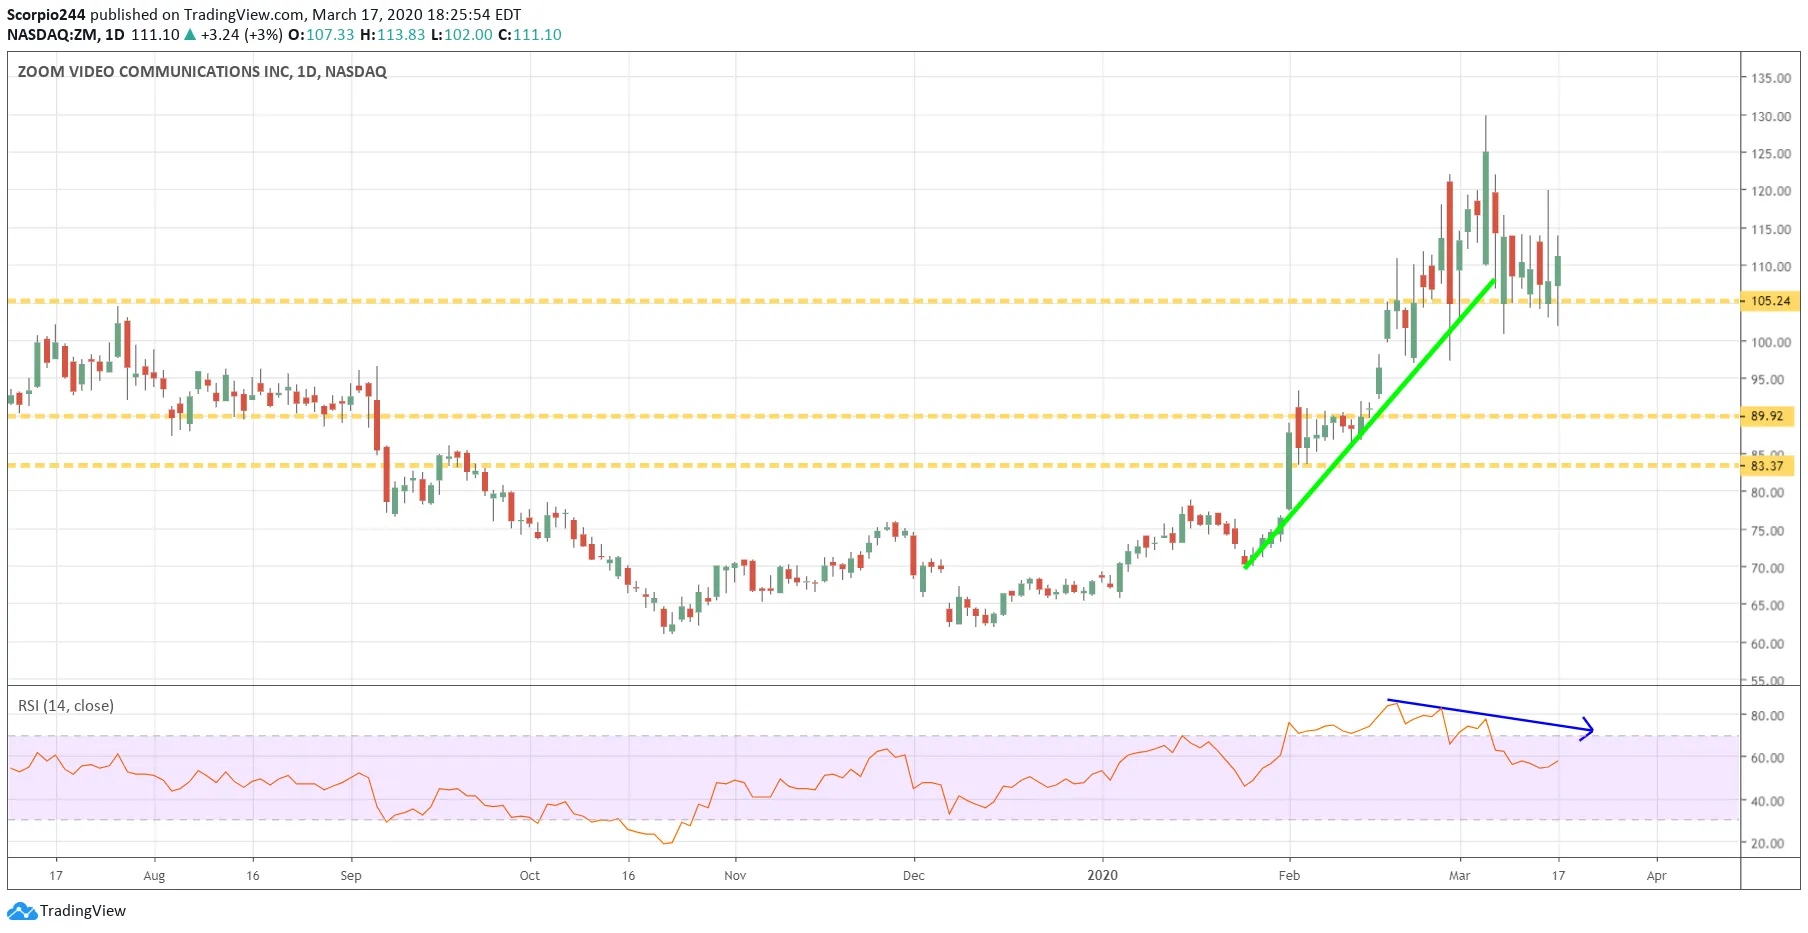
Zoom (NASDAQ:ZM) is a new one I was asked to look at. I’m sorry to say the chart isn’t all that impressive, given the bearish divergence forming between the stock price and the RSI, not to mention the uptrend is broken. If the stock breaks support at $105, it likely heads back down to $90.
Tesla (TSLA)
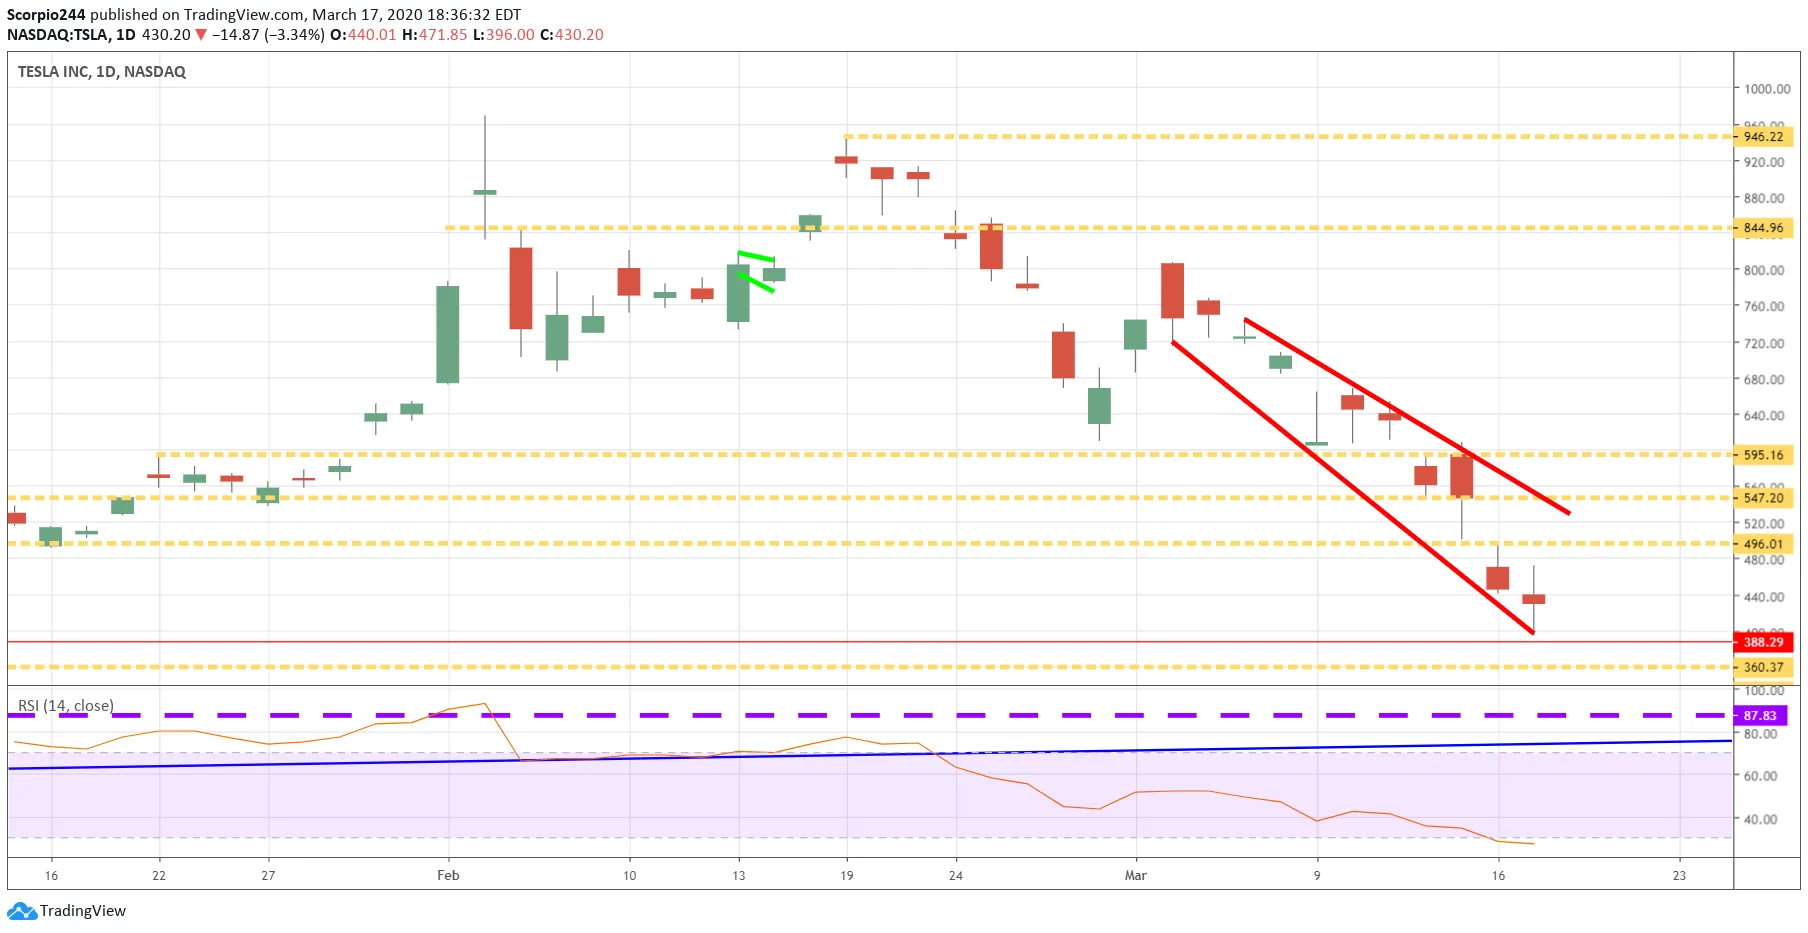
Tesla (NASDAQ:TSLA) stock hit oversold conditions yesterday with and RSI falling below 30. The stock got pretty close to the old ATH’s at around $390, which should offer a healthy level of technical support. Anyway, long story short I think the stock rebounds to $500.
