The Charts Suggest that a Major Advance Could Occur in the Cable and FTSE
Charts do NOT predict the future. Charts simply allow for possibilities. The charts presently allow for the possibility of a massive advance in the stock market and currency of Great Britain.
The cable has traded in a range of $1.35 to $2.00 since 1987 and a much tighter range of $1.4000 to $1.6740 (weekly closing basis) for the past five years.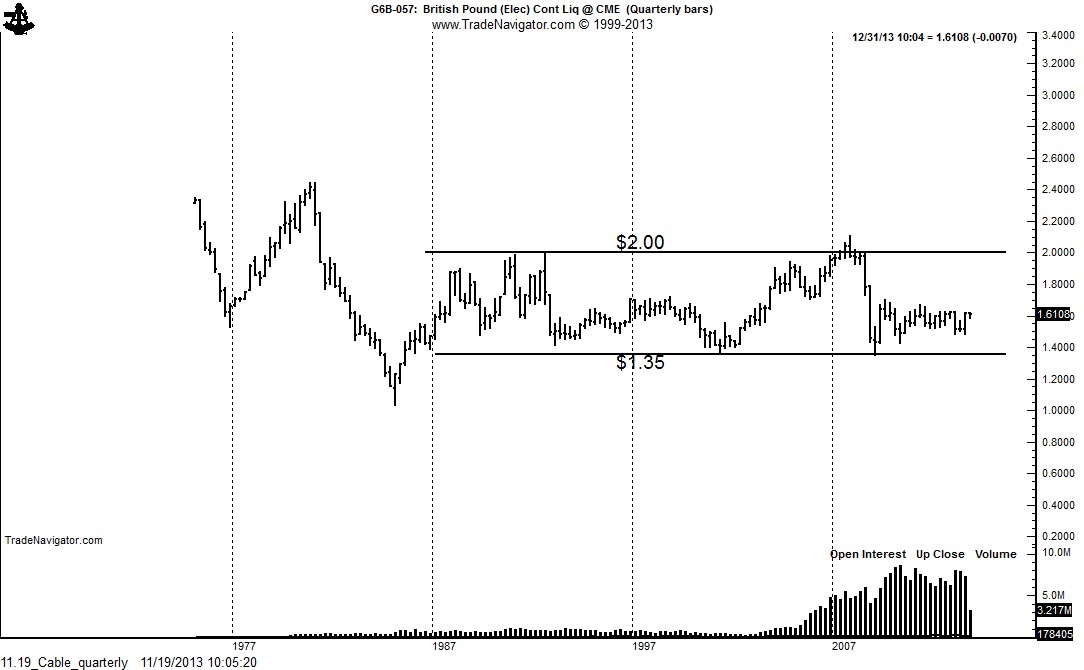
The weekly chart displays a possible 5-contact point coiling triangle. This triangle would be completed if cable can close convincingly above 1.6750. Such an event could make possible an advance to $2.0000.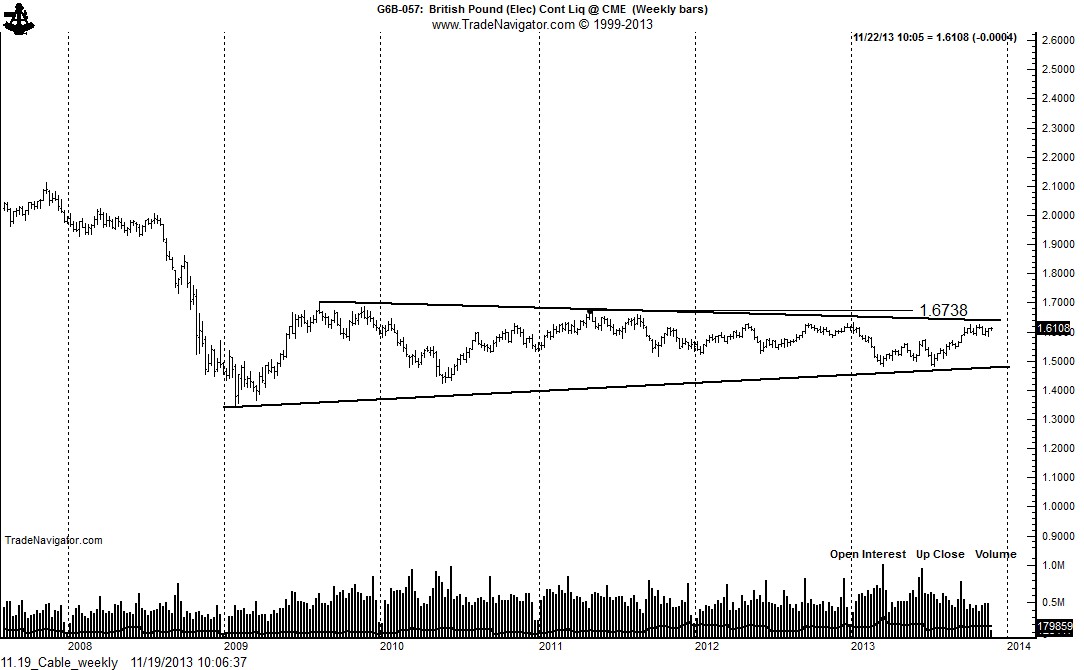
The daily Cable chart displays a 9-week rectangle or box pattern. A decisive close above $1.6250 could be the ignition for the completion of the weekly chart triangle.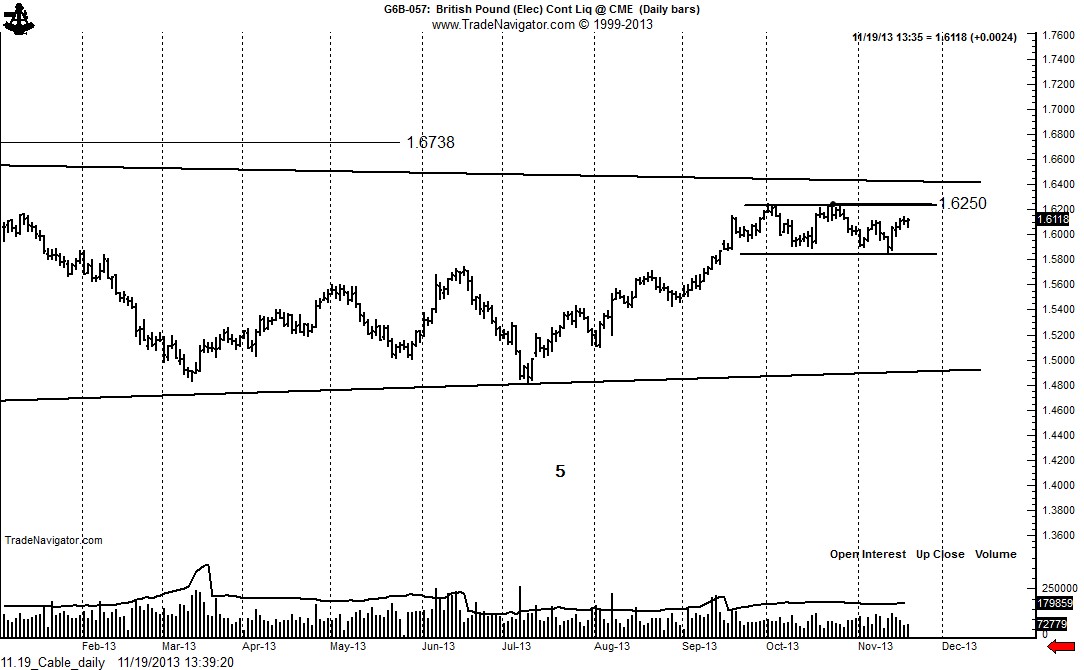
The FTSE presents a quite dramatic story. This benchmark index has been turned back from the 6800 to 7000 zone three times since 1999. A strong advance over this resistance level could usher in a significant advance in U.K. equities. The charts would indicate a possible target in the area of 9500.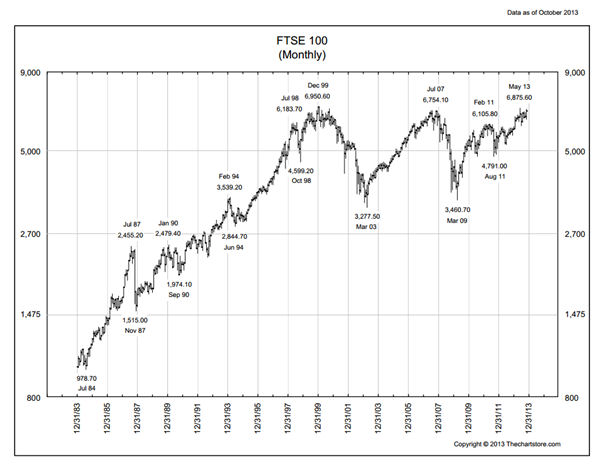
George Soros postnote:
There is much historical reference to when Geroge Soros took the Bank of England out behind the wood pile. So I thought I would include the chart of the trade that made Soros a billion pounds. Cable topped at $2.0100 on September 8, 1992. Over the next 11 trading days Cable dropped to $1.6764 and then to $1.4063 by February 1993.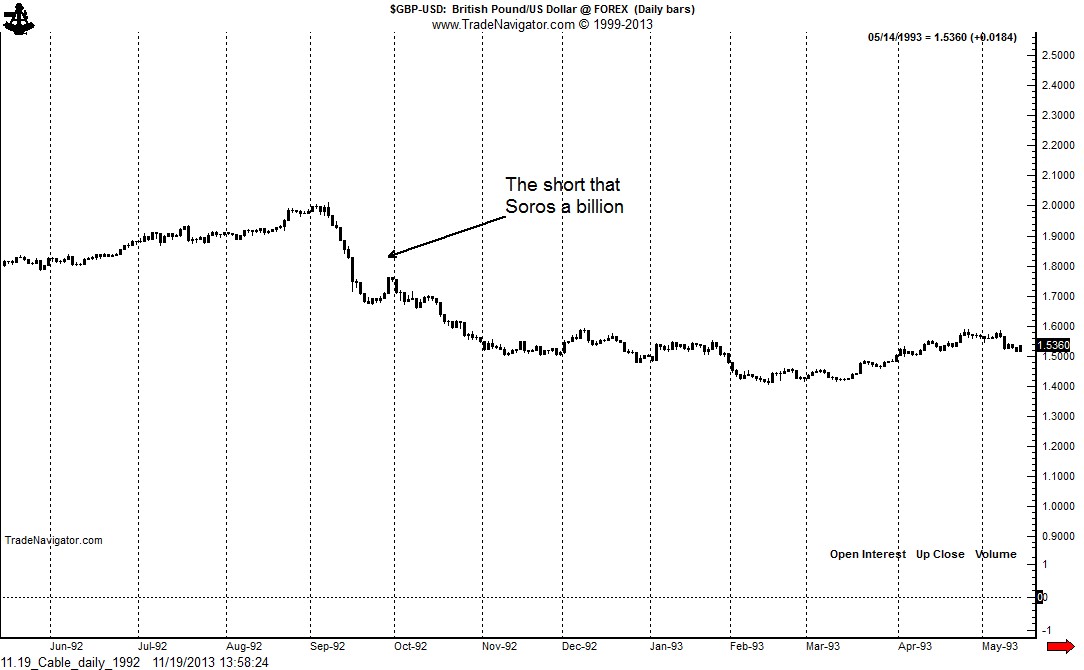
Disclosure: The information in this blog post represents my own opinions and does not contain a recommendation for any particular security or investment. I or my affiliates may hold positions or other interests in securities mentioned in the Blog, please see my Disclaimer page for my full disclaimer..
- English (UK)
- English (India)
- English (Canada)
- English (Australia)
- English (South Africa)
- English (Philippines)
- English (Nigeria)
- Deutsch
- Español (España)
- Español (México)
- Français
- Italiano
- Nederlands
- Português (Portugal)
- Polski
- Português (Brasil)
- Русский
- Türkçe
- العربية
- Ελληνικά
- Svenska
- Suomi
- עברית
- 日本語
- 한국어
- 简体中文
- 繁體中文
- Bahasa Indonesia
- Bahasa Melayu
- ไทย
- Tiếng Việt
- हिंदी
The Technical Case For Why I'm Bullish On Great Britain
Published 11/20/2013, 04:12 AM
Updated 07/09/2023, 06:31 AM
The Technical Case For Why I'm Bullish On Great Britain
Latest comments
Loading next article…
Install Our App
Risk Disclosure: Trading in financial instruments and/or cryptocurrencies involves high risks including the risk of losing some, or all, of your investment amount, and may not be suitable for all investors. Prices of cryptocurrencies are extremely volatile and may be affected by external factors such as financial, regulatory or political events. Trading on margin increases the financial risks.
Before deciding to trade in financial instrument or cryptocurrencies you should be fully informed of the risks and costs associated with trading the financial markets, carefully consider your investment objectives, level of experience, and risk appetite, and seek professional advice where needed.
Fusion Media would like to remind you that the data contained in this website is not necessarily real-time nor accurate. The data and prices on the website are not necessarily provided by any market or exchange, but may be provided by market makers, and so prices may not be accurate and may differ from the actual price at any given market, meaning prices are indicative and not appropriate for trading purposes. Fusion Media and any provider of the data contained in this website will not accept liability for any loss or damage as a result of your trading, or your reliance on the information contained within this website.
It is prohibited to use, store, reproduce, display, modify, transmit or distribute the data contained in this website without the explicit prior written permission of Fusion Media and/or the data provider. All intellectual property rights are reserved by the providers and/or the exchange providing the data contained in this website.
Fusion Media may be compensated by the advertisers that appear on the website, based on your interaction with the advertisements or advertisers.
© 2007-2024 - Fusion Media Limited. All Rights Reserved.
