Bottom Line:
The price action of Soybeans, Soybean Meal, and Soybean Oil during the past 6 months has either been trading sideways or putting in a potential bottom. With recent price and actions of indicators, it looks like the Soybean Complex is setting itself to turn up with Soybean Oil leading the way
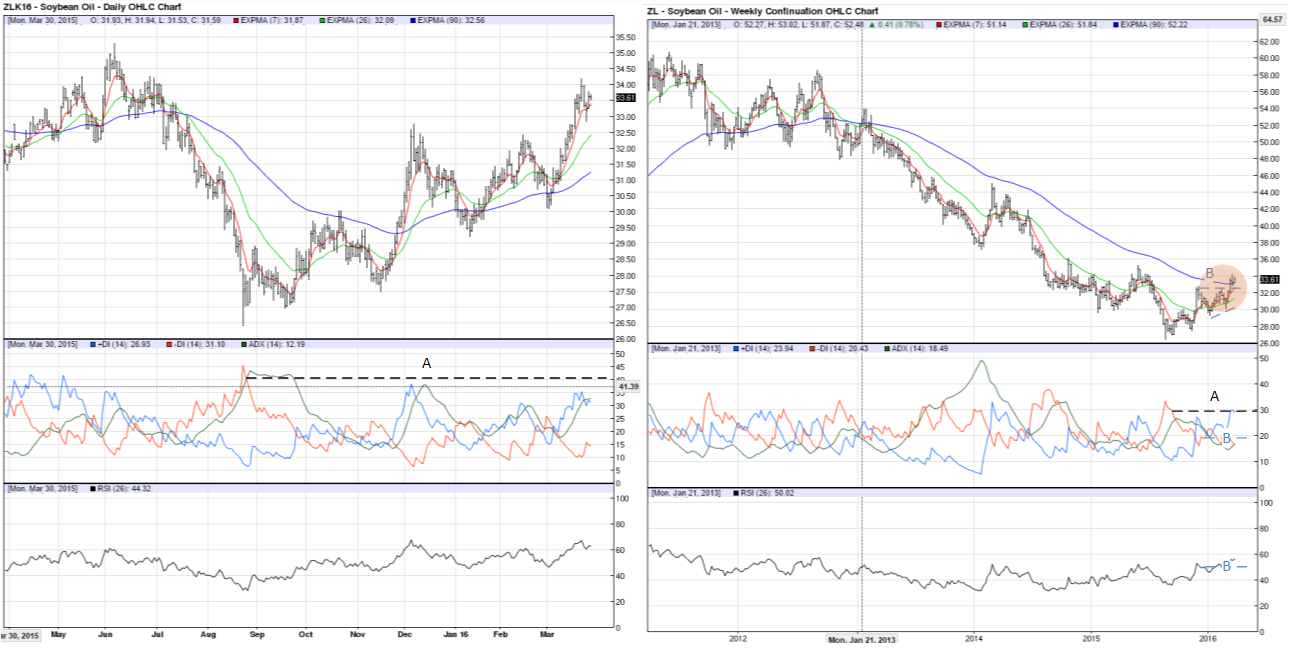
Soybean Oil
(Weekly)
-price action has the 7 period (7P) crossing up over the 26P EMA along with price moving above the 90P EMA. Price needs to hold above or close to the 90P EMA as does the 7P and 26P EMA.
-the +DI has not broken above the -DI level where the low was placed (A) but is close. A break above this line with price following/leading will add more to case that major trend is changing (especially with action on weekly chart)
-ADX had moved below 20 and/or +/-DI indicating consolidation. During the period, trends or patterns are identified and then a watch for price to break out (B). Within the past several weeks, Price has broken out of a consolidation pattern to the upside.
-the 21P RSI has moved above 50 and held signaling a positive environment to buy
(Daily)
-price has broken well above the 90P EMA as has the 7P and 26P. Price and short term EMAs have both found support on the 90P EMA. A pullback in near term in the range of the 26P EMA could present a buying opportunity
-ADX and +DI are both bullish but the +DI has yet to take out the -DI level from the previous low in price. This behavior continues to weigh in on the validity of a bullish trend reversal vs. a large scale correction
-21P RSI has held well above 50 and a pullback with price and RSI could signal a buying opportunity if both turn back up on support
What to Watch:
-Weekly price holds above or at the 90P EMA and the upper of the two lines (B) for support
-Daily price pullback into the 26P EMA and a convergence of the +/-DI along with the 21P RSI range of 50 holding. The combination of these three could confirm an up move and a place to enter this market on the long side.
Soybean Meal 
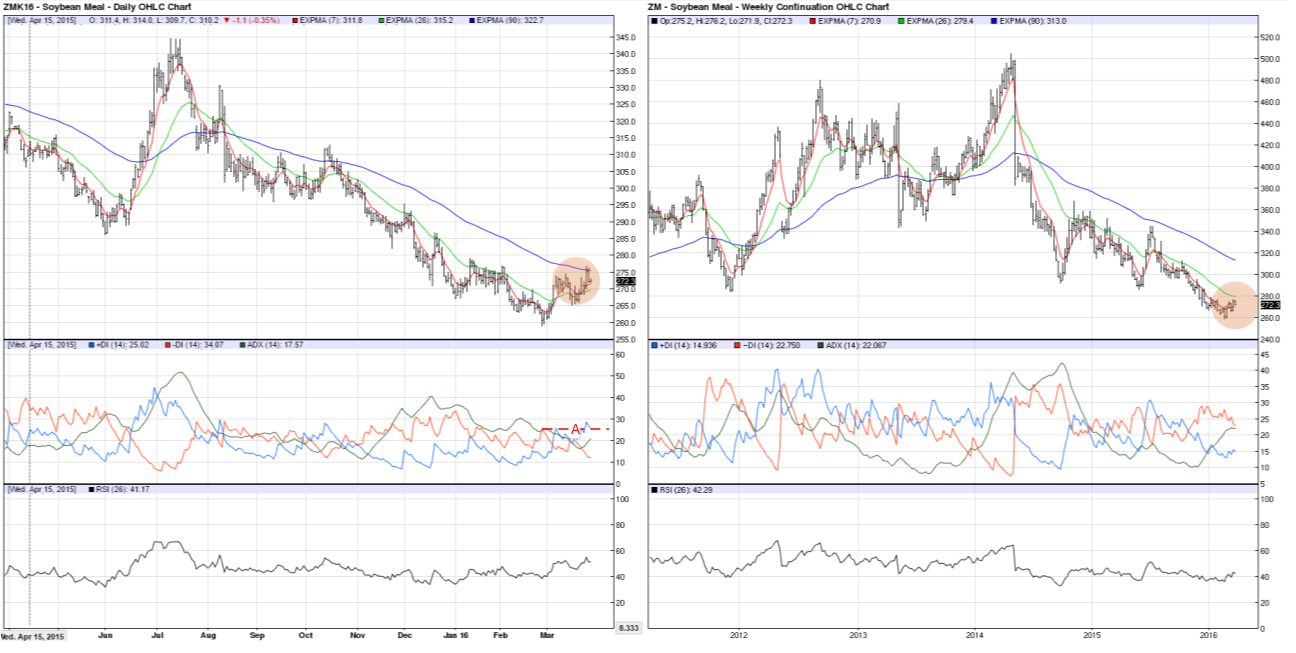
(Weekly)
-EMAs have not exhibited the name reversal patterns as Soybean Oil. In fact, Meal is still very much in a bearish trend on the weekly chart and it will take either time, price action or both to move this to the same trend as oil. However, the actions on the daily chart may be leading price in this direction.
(Daily)
-The 7P EMA has crossed up over the 26P and has held for a couple of weeks now. In the past days, price has hit resistance on the 90P EMA and has pulled back. Close attention should be paid over the next several days to determine if the 7P and 26P EMA will hold price and if price can break through the 90P EMA. A break and hold at this time could signal a further move up and be the catalyst required to begin to transition the weekly chart over to a more bullish trend
-The +DI has briefly broken the peak of the -DI put in on the low in late February (A). However, in order for this action to have significance, there must be a follow through along with price. A break of price above the 90P EMA would seem to address this.
-The 21P RSI has pushed above 50 and has held providing another confirmation of a bullish sentiment
What to Watch:
-Daily price breaks above the 90P EMA that pulls the 7P and 26P EMA with it. The +DI continues to hold current levels and pulls ADX up above 20. The 21P RSI holds at 50 and moves up with price
A failure to break the 90P EMA on daily chart will likely result in a continued down trend of this market.
Soybeans 
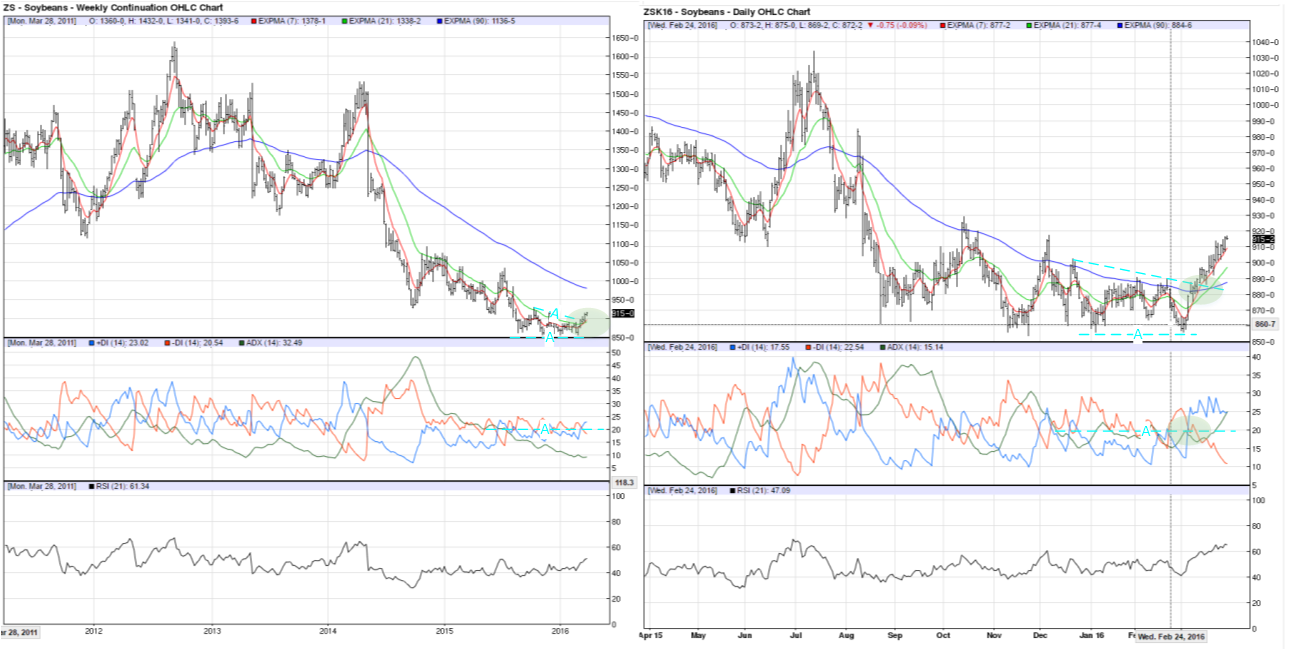
(Weekly)
-Price has begun to move up. The 7P EMA has crossed up over the 26P EMA but everything is still well below the 90P EMA
-The ADX has trended well below 20 and the +/-DI for some time now setting up a period of consolidation in price (A). In the past several weeks, price has broken out above the top trend line signaling a potential move up
-The 21P RSI has crossed above 50. If this level holds with price moving up, a positive signal for more up movement.
(Daily)
-Price has moved up sharply over the past several weeks off of substantial support. The 7P EMA has crossed above over both the 26P and 90P EMA as has the 26P above the 90P. At this point, a pullback could provide an opportunity to enter the market long
-ADX had been moving mostly below 20 since mid-December setting up consolidation in price. Resistance on the trend lines for this consolidation coincided with the 90P EMA and both Price and other EMA marched through without pausing. With this action, a pullback resulting in the +/-DI converging could provide an opportunity to enter the market long
-The 21P RSI has moved above 60 and any pullback in price and the range of 50 supported would confirm the other indicators of a long side play.
What to Watch:
-Weekly price continues up to hold and pulls the 7P EMA through the 26P and holds. The ADX begins to turn up and the +DI continues up with price. The 21P RSI holds 50 and moves up with price
-Daily price pulls back into the 26P EMA range with +/-DI converging and ADX pausing briefly. The 21P RSI pulls back into a 50 range and holds. These actions could provide opportunity to enter long positions and up movement from these levels should bring weekly chart into alignment with daily signals.
