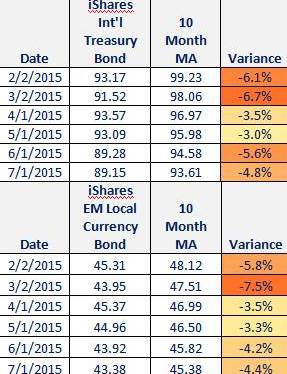
Initial Jobless Claims
Following last week’s spike in initial jobless claims, this past week saw a modest pull back to 281k, slightly better than the 285k expectations, but hovering at the average for the year, notably confirming that post-QE3 we have seen the improving trend in claims cease.
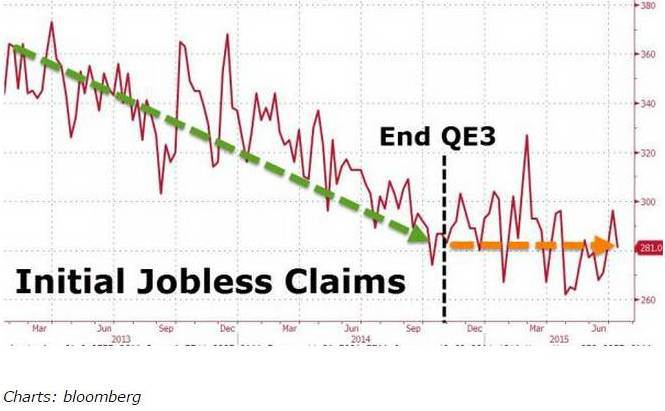
Inflation and Wage Growth
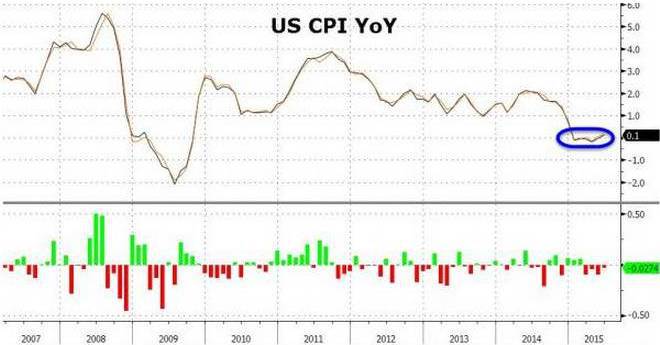
Following a small dip in May CPI ex Food & Energy YoY, June saw a rise of 1.8% (as expected), hovering near the highest since October. Headline CPI continues to trot along the flatline (printing +0.1% YoY as expected).
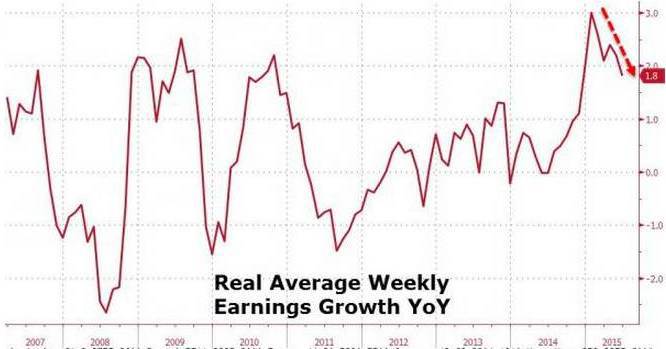
However, all of this pales when compared to the continuing slide in real wage growth, which has slowed almost every month since its peak in January, and now stands at 7 month lows.
Housing
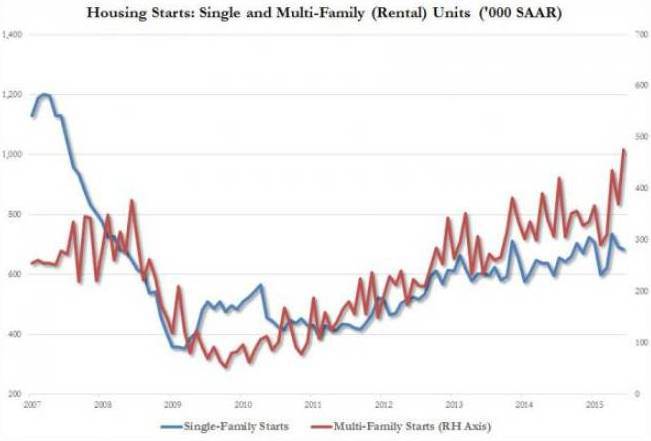
Once upon a time, the US housing market was mostly about single-family, residential units. Those days are long gone; instead, now it is all about renting. For June, single-family starts and permits (blue line) declined from 691K to 685K, the lowest level since March. However, it was the multi-family, aka rental housing (red line), where the action has rarely been hotter.
But this was nothing compared to permits, where once again, it was all about multi-family units.
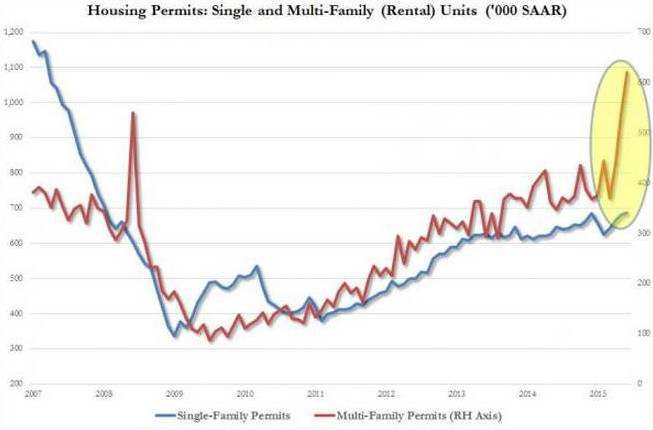
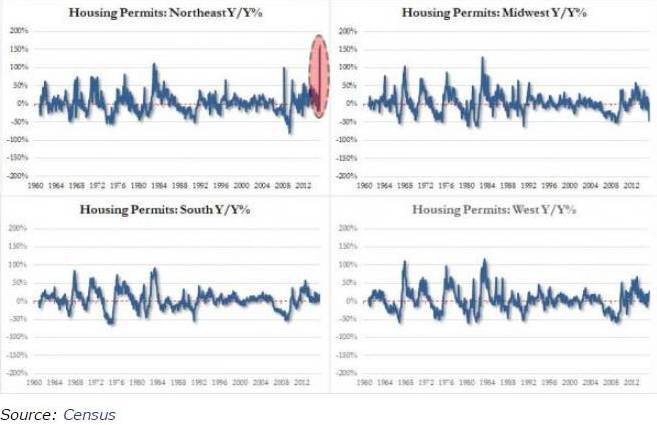
A conventional housing recovery is dead: the next generation wants to rent, not to own. The following chart illustrates where the building frenzy is taking place.
In the Northeast, permits increased by 160%. Everywhere else was flat or negative.
Sentiment
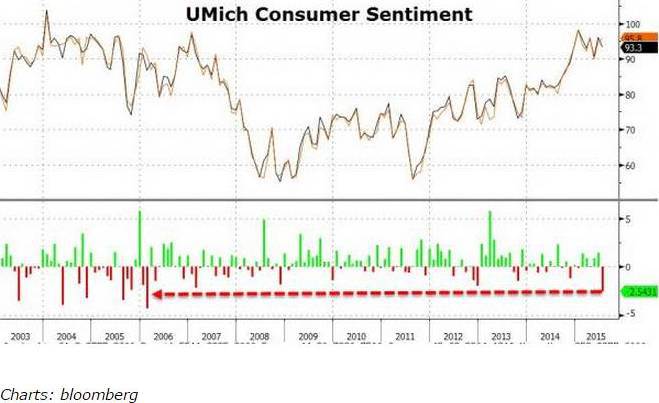
Since January’s exuberant peak, consumer sentiment has drifted lower. Expectations for July’s preliminary data was 96.0, but the 93.3 print is the biggest miss since 2006. Both current and future “hope” conditions dropped, with details showing Americans less certain about retirement, less confident about income growth outpacing inflation, and businesses considerably less confident.
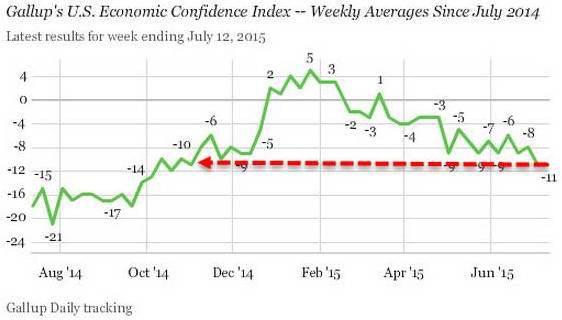
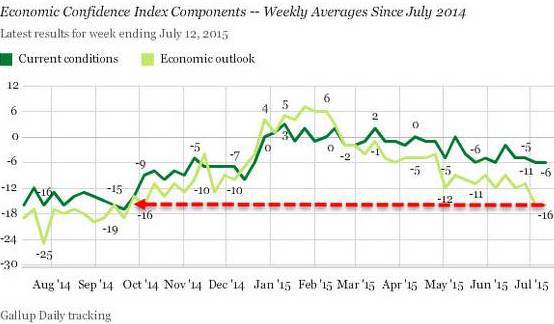
Gallup’s U.S. Economic Confidence Index registered at -11, an eight-month low for the index. While current conditions are weak, more worryingly, the economic outlook has tumbled to its lowest since October, with 56% of Americans saying “the economy is getting worse.”
The economic outlook score was also unchanged, at -16 — the result of 40% of Americans saying the economy is “getting better,” while 56% said it is “getting worse.”
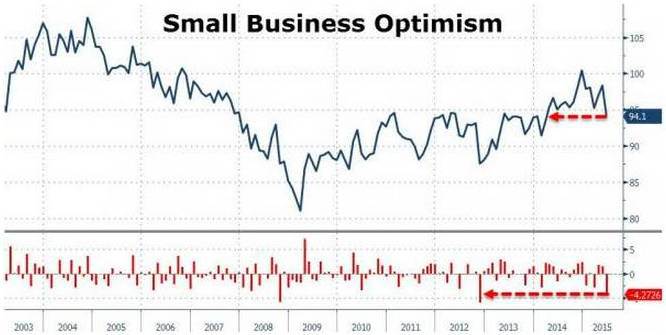
The NFIB small business optimism index disappointed expectations in June (94.1 vs. consensus 98.5), falling to its lowest level since March 2014 – the biggest drop since 2012.
Retail Sales
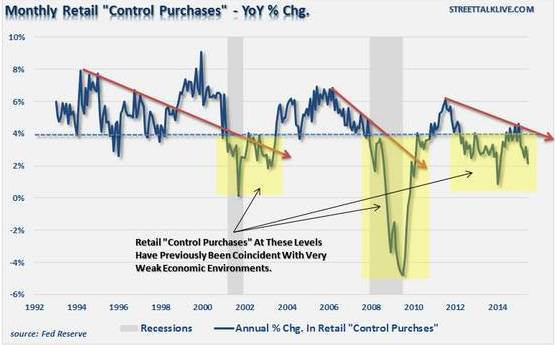
The recent report on June retail sales confirmed broad weakness — it came in way below expectations, at minus 0.3 percent. To understand the “economic story,” data must be analyzed within the context of the trend in retail “control purchases,” which is currently operating at levels that have only previously been witnessed during recessionary periods.
Inventories
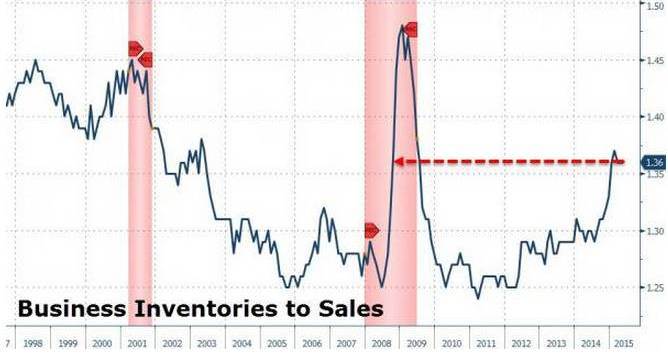
With a 0.3% rise MoM (as expected), Business Inventories grew for the 4th month in a row (but growth slowed in May from April). Sales rose slightly more MoM (+0.4%), but this left the crucial inventories-to-sales ratio deep in recession territory, with the highest level of inventories-to-sales since Lehman…
Production & Manufacturing
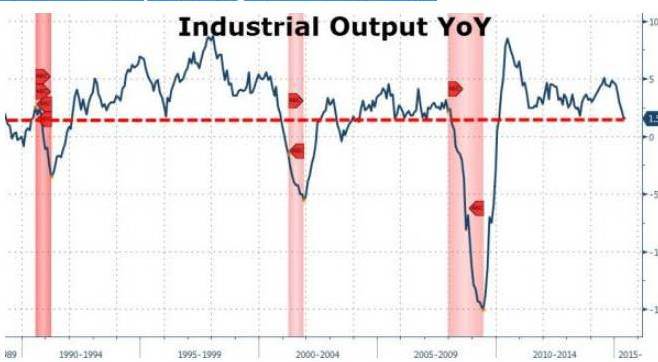
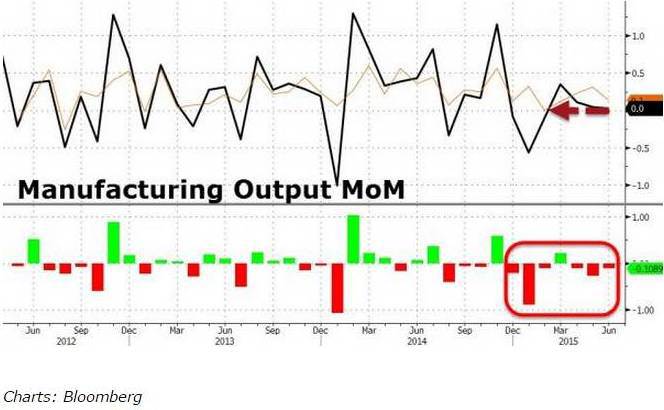
Industrial Production rose just 1.54% YoY, the weakest growth since Feb 2010, and flashing a major recessionary red light. Utilities were the biggest contributor, as Manufacturing output ended June unchanged (against expectations of a modest 0.1% rise), missing for the 2nd month in a row. Notably vehicle production tumbled 5.5% MoM.
Worst manufacturing output growth since February…
GDP Growth Expectations
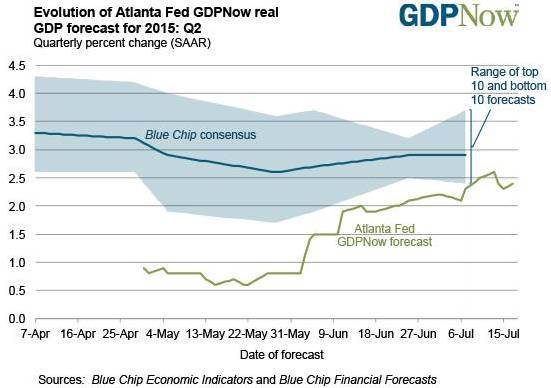
The GDPNow model forecast for real GDP growth (seasonally adjusted annual rate) in the second quarter of 2015 was 2.4 percent on July 17, unchanged from July 14.
Asset Allocation Summary:
Major Asset Class Allocations – 5% Stocks, 75% Bonds, 20% Cash
Developed and Emerging Allocations – 87.5% Developed, 12.5% Emerging
Developed Country Stock Allocations – Germany, France, Italy
Emerging Country Stock Allocations – Mexico, Indonesia, India
US Bond Allocation – 62.5%
Int’l Developed Bond Allocation – 2.5%
Int’l Emerging Bond Allocation – 10%
Int’l Developed Stock Trend – bearish
Int’l Emerging Stock Trend – bearish
US Bond Trend – bearish
Int’l Developed Bond Trend – bearish
Int’l Emerging Bond Trend – bearish
Int’l Developed Stock Trend – bearish
OVERALL RECOMMENDATION – hold existing allocations / no new allocation commitments due to trends
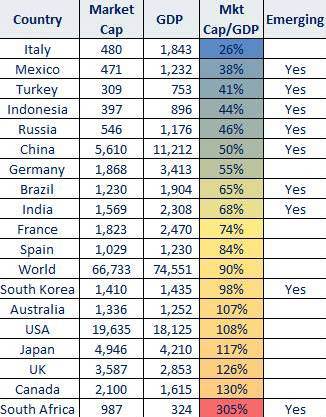
Country Stock Fundamentals – Market Cap/GDP ratios (April)
Emerging market stocks (Brazil Russia India China particularly) offer the best value.
Note: International Monetary Fund GDP numbers come out in April and October.
Developed and Emerging
Emerging and BRIC

Yields
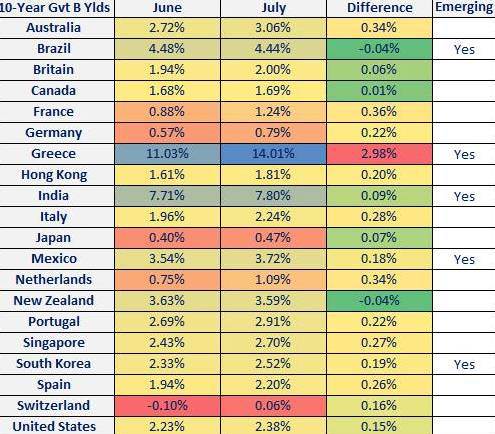
Bond yields are going up across both developed and emerging economies.
Dynamic Asset Class Expectations
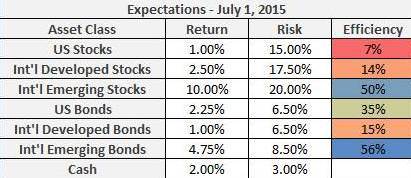
Shiller’s 10 Year CAPE Ratio is at 27.30 translating into a 1% 10 Year expected return on US stocks.
Dynamic Asset Allocation
The most attractive mix is position 1.

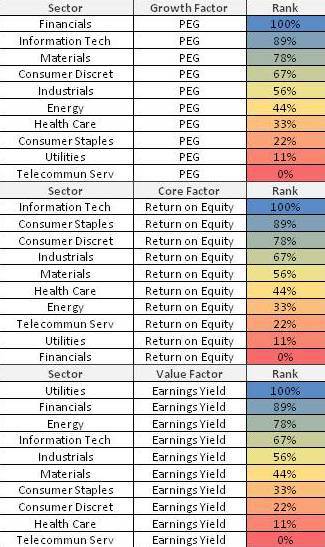
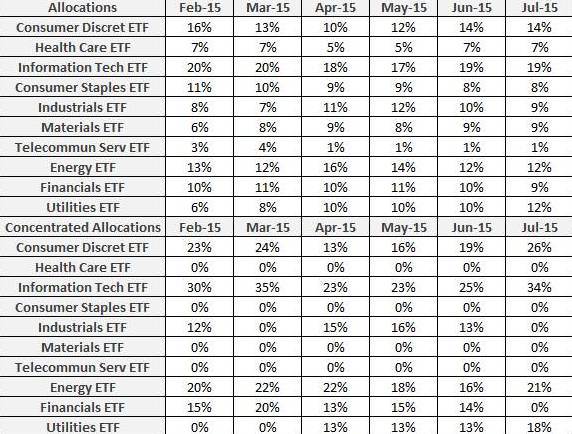
US Stock Sector Fundamentals – June data
US Sector Allocations
International Stock Allocations
When we look at Market Cap/GDP/Volatility (April), our most attractive countries are mostly emerging.
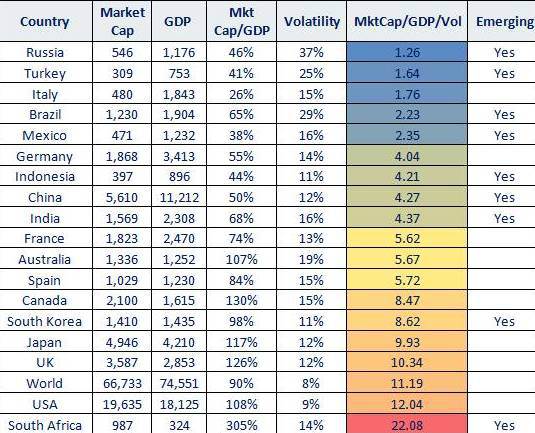
To ensure allocations are higher quality means considering the elimination of countries with high volatility including – Russia, Turkey, and Brazil
Trade Execution – Utilizing Monthly Price Trends (and Volatility)
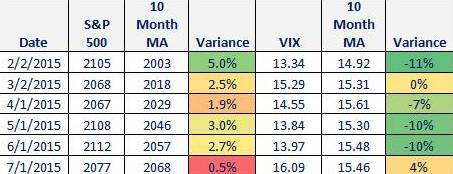
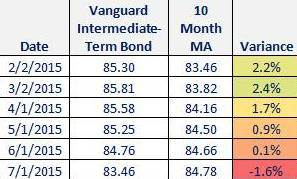
The following cyclical tables get to the heart of timing and when the trend in prices is optimal (bull) for buying.
US Stocks and Bonds
Neutral price / volatility trend is in place for stocks.
On bonds, the trend has turned bearish.
International Stocks
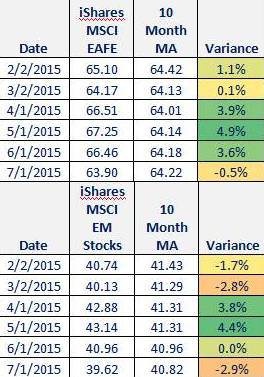
The trend has turned bearish for both developed and emerging market stocks.
International Bonds
A bearish trend is still in place for both developed and emerging.
