The fall in oil prices is gathering much attention. Since mid June, light crude oil (WTIC) has fallen by about 40%. Current prices are the lowest since September 2009, more than 4 years ago.
You would guess that this would be bullish for equities. After all, a lower gas bill leaves consumers with extra cash for other purchases. So lower oil should mean a higher SPX.
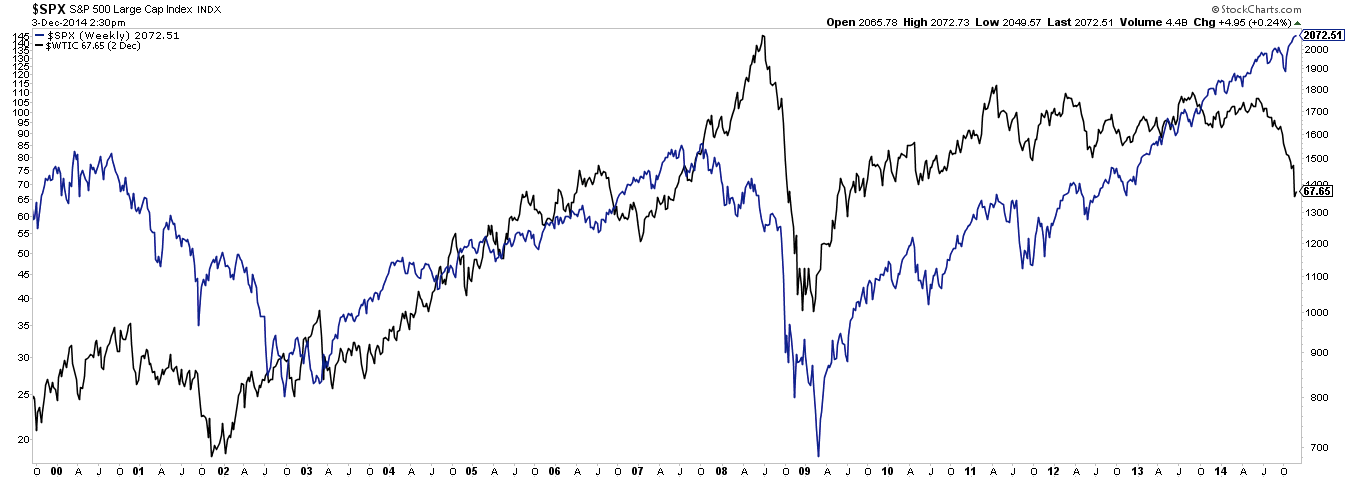
But that doesn't look like it's been the case in the past. Since 2000, SPX (blue) and WTIC (black) have moved more or less in the same direction. SPX has risen when oil prices have risen, and fallen when oil prices have fallen.
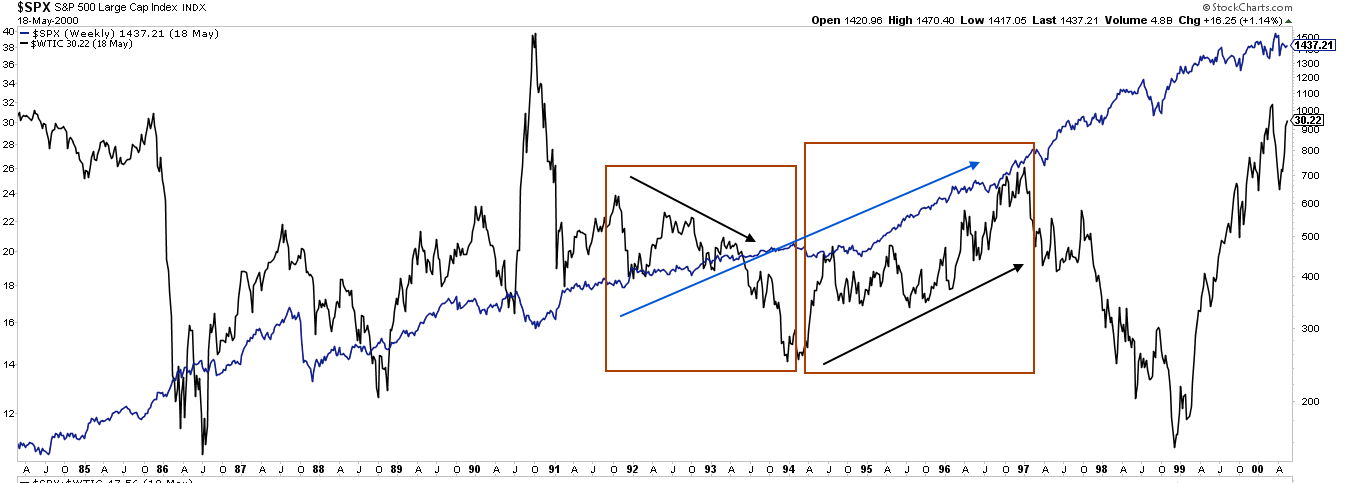
The relationship between these two in the prior 15 years is more muddled. Between 1985 and 2000, SPX mostly moved higher while oil prices mostly went sideways. In between, there were periods of positive and negative correlation lasting years. Oil prices dropped 40% between late 1991 and early 1994 while SPX moved higher. Then, oil prices increased more than 100% between 1994 and 2000 and SPX marched steadily higher. Low oil prices in January 1994 preceded a 10% fall in SPX over the next two months.There's no discernible, consistent correlation.
Why is this relationship so confused? Partly, of course, because equity prices are driven by more than just the price of oil; put another way, oil prices on their own aren't sufficient to consistently steer equity prices up or down.
Moreover, the price of oil is probably less important to equities than the demand for oil. Consider two cases where oil prices fall, one driven by an increase in supply and the other driven by a fall in demand. Lower oil prices, when the drop is purely supply driven, are a boom to consumers and thus SPX. Equities should rise.
But if the drop is driven by demand, then lower oil prices reflect a weak economy and SPX should fall. The sharp fall in oil prices in 2008 is the best example of this; demand fell more dramatically than at any time in the prior 20 years. The same was true in the early 1990s.
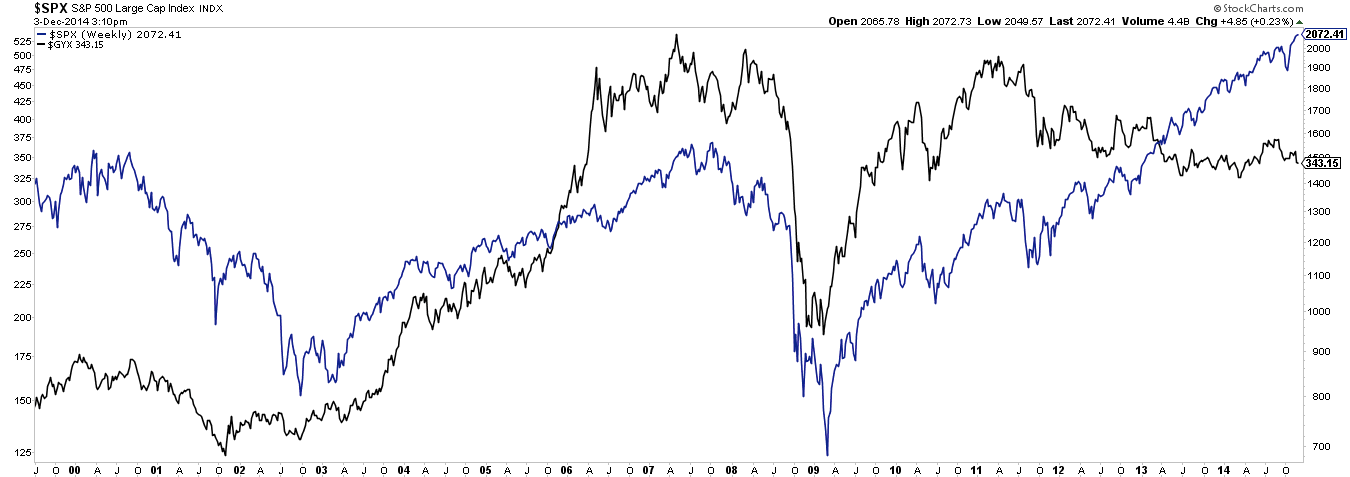
Which brings us to today. Weak demand is an important contributor to the current weakness in oil prices. That should be intuitive. After all, it's not just oil prices that are weak; copper, steel and other industrial metal prices (shown below) have also been falling. Low interest rates, globally, also indicate tepid economic growth. Falling oil is one more example of what we are seeing more broadly in the economy.
Oil demand has been flat at around 92.6 mbd (million barrels per day) for the past 5 months. The yoy annual growth rate in September fell to 0.6% from 1.8% a year earlier. It's not China's fault: non-OECD (emerging markets) demand is growing at 1.8% yoy. Meanwhile, demand from the OECD (developed countries) fell 0.6% yoy due primarily to poor demand from Europe and Japan (data and chart from Ed Yardeni).
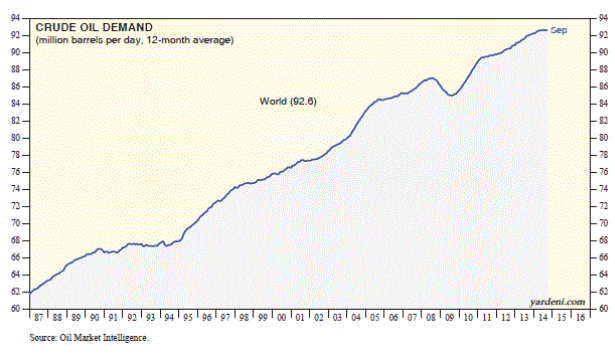
It's too early to say this alone represents a risk to SPX: demand has flattened before (1992-94) and SPX moved higher. But to the extent oil demand reflects economic growth, the current weakness is coming right when US equity valuations reflect great optimism that overall consumer consumption will expand more rapidly in 2015.
Greater oil supply is obviously contributing to lower prices as well. In fact, it's the increase in oil supply that has grabbed all of the news headlines. Last week, Saudi Arabia (OPEC) decided it would not lower production in spite of soft demand; this sent oil prices down more than 10% in one day.
How the excess of supply over demand will resolve in the short term is very hard to say with any certainty because it's not just about business: there is a lot of politics wrapped up in current decisions surrounding oil supply.
Saudi Arabia wants to maintain its market share, but it also wants to penalize Iran, which has been trying to expand its influence in the region and develop its capacity to enrich uranium (article).
Russia is also part of the mix: lower oil prices are a disaster for the Russian economy and allow the west to pressure Putin in the wake of his country's incursion into the Ukraine (article). The GDP of both Iran and Russia is highly dependent on oil exports.
It's not hard to see why oil prices could remain soft for a while with oil supply tied up in geopolitics. For investor's looking to trade oil, this is the biggest source of risk.
But, current oil prices are probably unsustainably low longer term, assuming that demand does not plummet. Here's the math:
- Excess oil supply (over demand) is presently about 1 mbd.
- That would be a problem for oil prices except for one thing: existing fields lose about 6% of their production capacity each year, equal to about 5.5 mbd.
- That means that even if demand is flat, at least 4.5 mbd in new production is needed.
- OPEC has spare capacity of only about 3 mbd.
- The remainder must come from new investment. New deep water and oil sand projects have a breakeven cost of about $80-90.
- There will be little incentive to make these investments unless the price of oil is at least $80. If the price stays lower than $80, supply will be insufficient for demand. It's exactly under those circumstances that spikes higher in oil prices have occurred in the past.
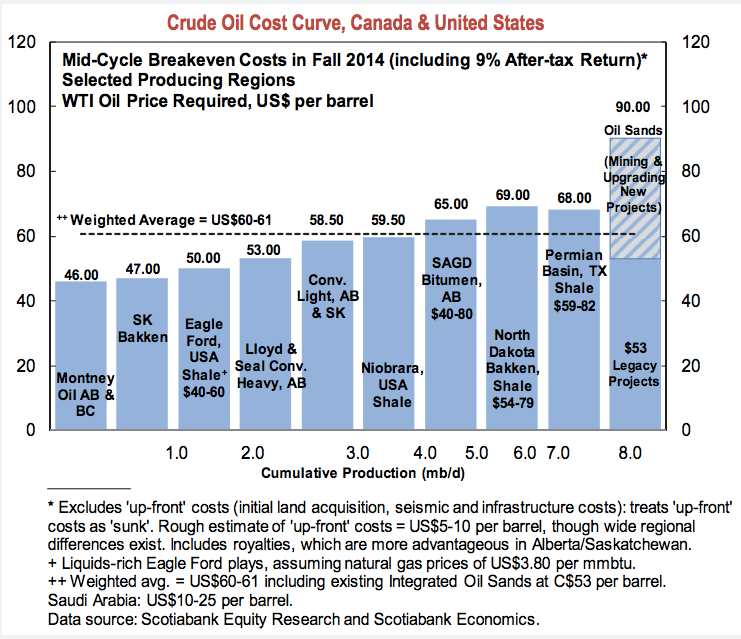
Technically, it's not hard to see why $80 is an important threshold: that had been the low support level for WTIC the past 4 years (since 2011). Regaining the $70 level (the lows from 2010) is the first hurdle.

Again, in the near term, politics make the math behind new investments mostly moot. And anyone with a memory longer than 6 years knows how far prices can fall below cost when demand falls. These are the risks. But assuming the world is not on the precipice of a major recession, the price of oil should make its way higher to at least $80 over the next year. That's 20% above yesterday's close.
