Summary- China data continues to soften.
- The Fed's Meeting Minutes pointed towards an economy in good shape but with rising levels of trade-caused uncertainty.
- Despite a dovish Fed, the markets don't seem to be in strong rally mode.
EU/UK/Canada
Canada
- Building permits decline 15%
- UK
- Rolling 3-month GDP growth at .3%
- Production increased .3% on a 3-month basis
- EU
- EU industrial production increased .9% M/M
China/Japan/Asia
Japan
- PPI down .5%
China
- PPI at 0% Y/Y
- CPI at 2.7% Y/Y
- Vehicle sales down 9.6% Y/Y
- Exports down 1.3% Y/Y
- M2 up 8.5% Y/Y
- Loans up 13% Y/Y
China conclusion: the Chinese economy is still softening, with vehicle sales and exports weakening. The central government continues to add stimulus by increasing loans and the money supply.
Central Bank Actions
The Bank of Canada maintained rates at 1.5%. Their policy announcement had several key paragraphs:
Evidence has been accumulating that ongoing trade tensions are having a material effect on the global economic outlook. The Bank had already incorporated such negative effects in previous Monetary Policy Reports (MPR) and in this forecast has made further adjustments in light of weaker sentiment and activity in major economies. Trade conflicts between the United States and China, in particular, are curbing manufacturing activity and business investment and pushing down commodity prices.
The Federal Reserve made similar observations in their latest Meeting Minutes (see below) as did the Bank of International Settlements. Weakness has also been observed in Japanese, Chinese, and South Korean exports, several Asian countries, and Australia.
Here is how the bank described the Canadian economy (emphasis added):
Following temporary weakness in late 2018 and early 2019, Canada’s economy is returning to growth around potential, as expected. Growth in the second quarter appears to be stronger than predicted due to some temporary factors, including the reversal of weather-related slowdowns in the first quarter and a surge in oil production. Consumption is being supported by a healthy labour market. At the national level, the housing market is stabilizing, although there are still significant adjustments underway in some regions. A material decline in longer-term mortgage rates is supporting housing activity. Exports rebounded in the second quarter and will grow moderately as foreign demand continues to expand. However, ongoing trade conflicts and competitiveness challenges are dampening the outlook for trade and investment. The Bank projects real GDP growth to average 1.3 percent in 2019 and about 2 percent in 2020 and 2021.
Although it has slowed, Canada's annual GDP growth rate is 1.3%. Since November, the unemployment rate has fluctuated between 5.4% and 5.8%. This has helped retail sales rebound over the last few months: the Y/Y percentage change increased from 0.7% in November to 3.7% in April. However, the manufacturing PMI has been decreasing for the last year and has been below 50 (the level that separates expansion and contraction) for the last three months. As a result, industrial production was soft the last four months.
Key US Data
This was a light data week for the US. However, the Federal Reserve issued the latest meeting minutes, which contained an excellent summary of the current state of the United States economy. It also offered key insights into certain weaknesses that have shifted the Fed's focus to a more dovish stance. Below are some key cites from the Minutes, which I encourage you to read in full (emphasis is added).
Weak Business Sentiment
The manager pro tem discussed developments in global financial markets over the intermeeting period. Trade-related developments reportedly led many market participants to take a more pessimistic view of the U.S. economic outlook.
The Fed has a manager who regularly interacts with other large, institutional investors while also participating in the market on a daily basis. He's hearing enough chatter about trade concerns impacting sentiment to consider it a key economic issue. This data point is confirmed by other reports such as the US' ISM manufacturing report and the various Markit reports issued monthly.
Soft Housing Data
Real residential investment in the second quarter looked to be continuing the decline seen earlier in the year, albeit at a slower rate. Starts of new single-family homes rose in April but fell back in May, while starts of multifamily units increased over both months. Building permit issuance for new single-family homes—which tends to be a good indicator of the underlying trend in construction of such homes—was at roughly the same level in May as its first-quarter average. Sales of new homes fell notably in April after a marked gain in March, and existing home sales edged down in April.
The following chart places that statement into perspective:
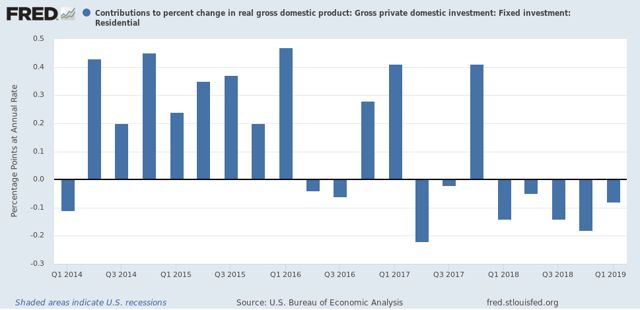
Residential investment has subtracted from GDP growth for the last five consecutive quarters and 7 of the last 12. Building permits -- a key leading indicator, have been moving lower for over a year:
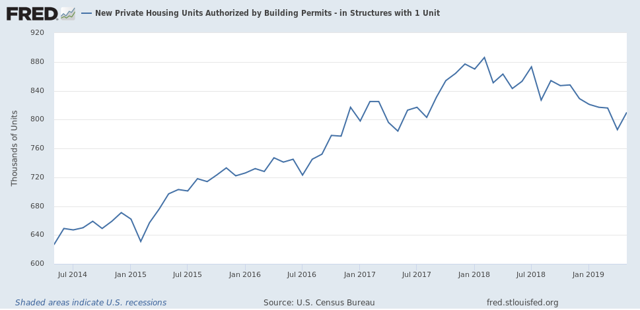
This decline isn't fatal -- it's best thought of as "soft" rather than "recessionary". But it does indicate weaker-than-desired demand for one of two key consumer durable goods purchases (the other being cars).
Weak Business Investment
Real nonresidential private fixed investment appeared soft in the second quarter. Real private expenditures for business equipment and intellectual property looked to be roughly flat, as nominal shipments of nondefense capital goods excluding aircraft moved sideways in April. Forward-looking indicators of business equipment spending pointed to possible decreases in the near term. Orders for nondefense capital goods excluding aircraft declined notably in April and continued to be below the level of shipments, readings on business sentiment deteriorated further, and analysts' expectations of firms' longer-term profit growth moved down sharply. Nominal business expenditures for nonresidential structures outside of the drilling and mining sector decreased in April, and the number of crude oil and natural gas rigs in operation—an indicator of business spending for structures in the drilling and mining sector—continued to decline through mid‑June.
This issue circles back to weaker business sentiment noted above. Weak sentiment delays corporate action, which is best seen in this chart of the Y/Y percentage change in new orders for non-defense capital goods: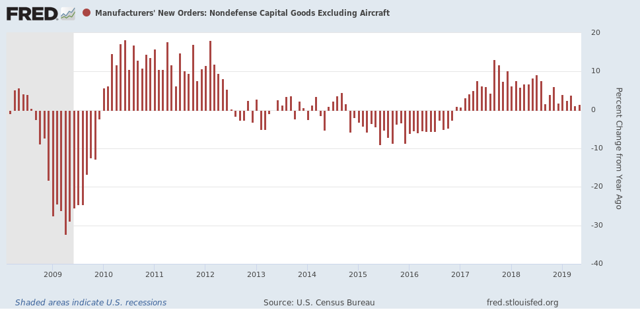
This data has been trending lower for the last two years and is about to go negative.
As a result ...
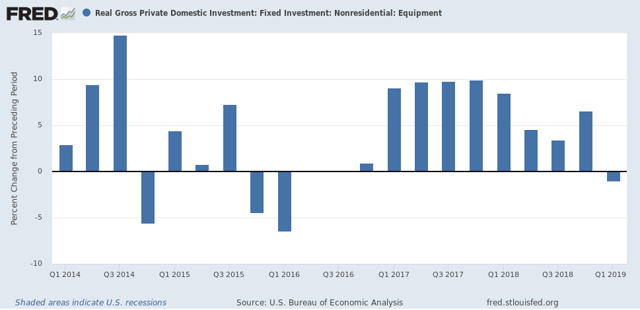
... nonresidential spending contracted in the first quarter on a Y/Y basis.
Weak Industrial Production
Industrial production moved down in April and picked up in May, leaving output about flat over those two months, but production was lower than at the beginning of the year. Manufacturing output declined, on net, over April and May, although mining output expanded. Automakers' assembly schedules suggested that the production of light motor vehicles would move up in the near term, but new orders indexes from national and regional manufacturing surveys pointed to continued soft total factory output in the coming months. Moreover, industry news indicated that aircraft production would continue to be slow in the near term.
Here's a chart of industrial production, which provides a good summation of the issues facing the business sector:
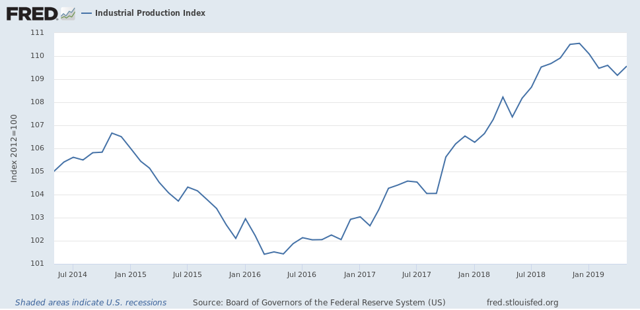
This coincidental indicator has been moving lower for the last 6-9 months.
Employment
The Fed generally noted that the labor market is in good shape, which the Atlanta Fed's Labor Market Spider Chart clearly shows: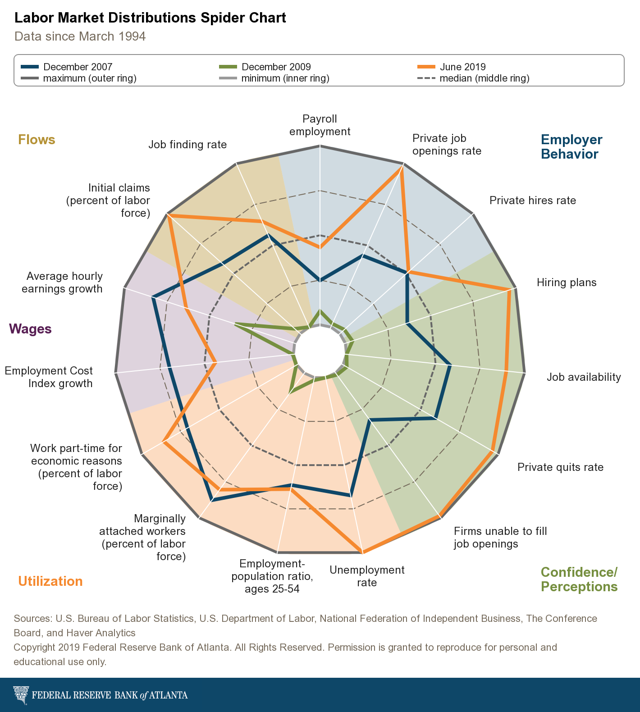
Spider charts show a variety of related data (see labels outside the circle) in a convenient format. The gold line shows the latest labor market data while the blue line shows the highs for that data from the last expansion. With the exception of marginally attached workers and wages, the current labor market is better than the heights of the last expansion.
Consumer Spending
Finally, the Fed noted that consumer spending -- which comprises about 70% of growth -- is in good shape:
Growth in real consumer expenditures appeared to pick up to a solid rate in the second quarter from its weak first-quarter pace. The components of the nominal retail sales data used by the Bureau of Economic Analysis to estimate PCE increased in May, and the retail sales data for the previous two months were revised up notably. Sales of light motor vehicles rose sharply in May after stepping down in April. Key factors that influence consumer spending—including a low unemployment rate, further gains in real disposable income, and still elevated measures of households' net worth—were supportive of solid real PCE growth in the near term. In addition, the Michigan survey measure of consumer sentiment edged down in the preliminary June reading but was still at an upbeat level.
There are a few data sets that confirm this analysis:
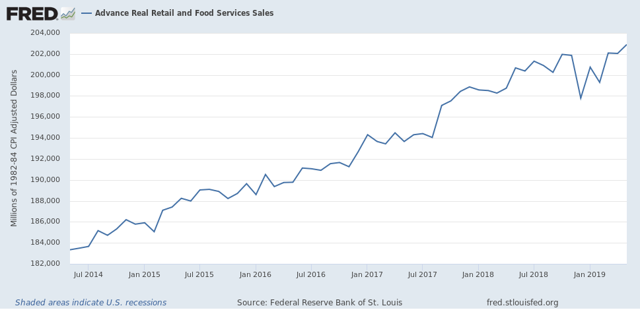
After dipping in 4Q18-1Q19, real retail sales have printed a series high for this expansion.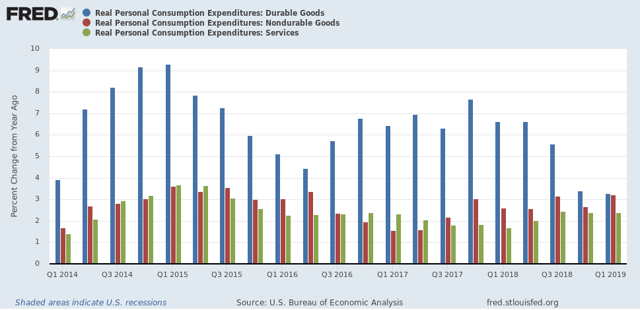
The Y/Y percentage change in the three categories of personal consumption expenditures are still expanding at solid rates, although durable goods spending is modestly weaker, which is shown in a bit more detail in the following chart: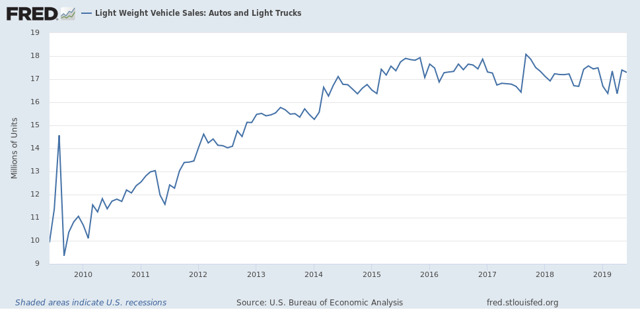
Light truck and auto sales peaked in the 2H15. Instead of contracting, however, they have moved sideways.
Finally, consumers are feeling very good:
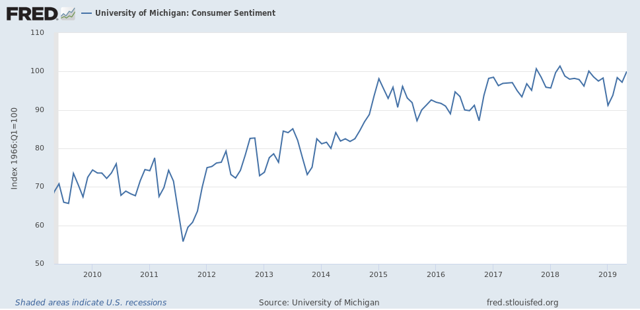
The University of Michigan's consumer sentiment survey is near highs for this expansion.
US Markets Weekly Performance
Here's the weekly performance table:
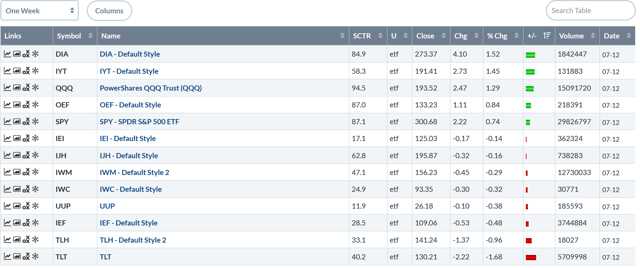
What kind of gains would you expect to see during the week when the Fed turned more dovish? The chances are this is not the performance table you'd expect. The Dow was up a mere 1.55%; the QQQs less so. Mid, small, and micro-caps were off marginally. On the plus side, the long-end of the Treasury market sold off
Let's turn to this week's charts, starting with the SPY:
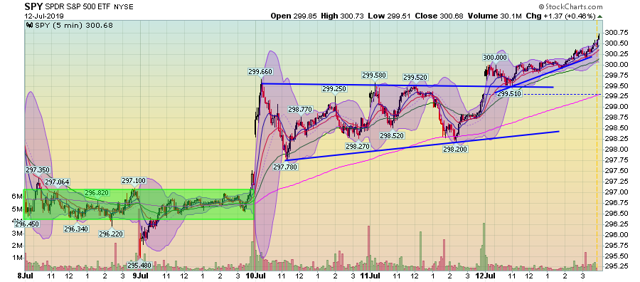
On the surface, this is a decent chart. Prices consolidated on Monday and Tuesday as the market waited for Powell's testimony. The market gapped higher on Tuesday morning and then consolidated gains through Friday's open. Today, the market opened higher and then trended higher for the rest of the day.
However -- the market heard very good news on Tuesday but then traded sideways for the next few days. That's not the biggest endorsement of the Fed's action.
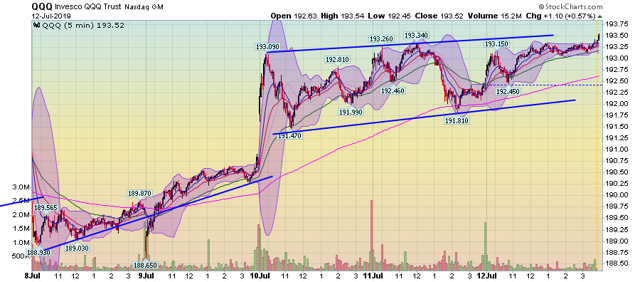
The situation with the QQQ is more pronounced: it gapped higher on Tuesday morning but then trended in a very modest upward sloping channel for the rest of the week.
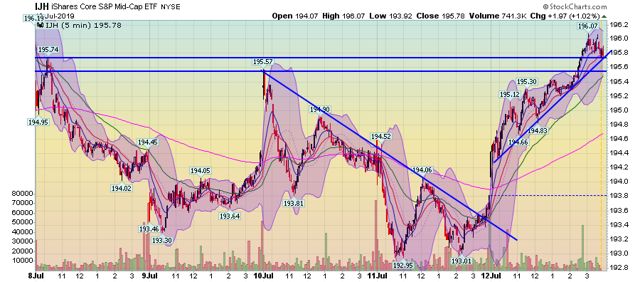
The mid-caps chart is worse. The index gapped higher on Tuesday morning and then trended lower for the next 1 1/2 days. True, the IJH rallied strongly on Friday but prices just barely made it above earlier-in-the-week highs.
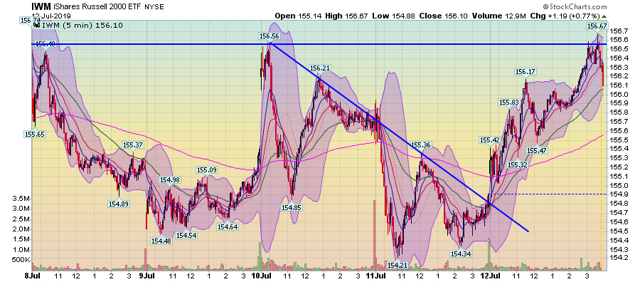
The IWM closely parallels the IJH. But this index sold off sharply on Friday at the close -- which is not a ringing endorsement of the market going into the weekend.
You'd think the market would be happier with a dovish Fed. While they rallied this week, you'd expect this with the financial winds at their back. Instead, the moves higher were less than impressive. You could argue that the market had already priced in the dovish Fed.
