Monitoring purposes Gold: Gold ETF GLD long at 173.59 on 9/21/11.
Long Term Trend monitor purposes: Flat

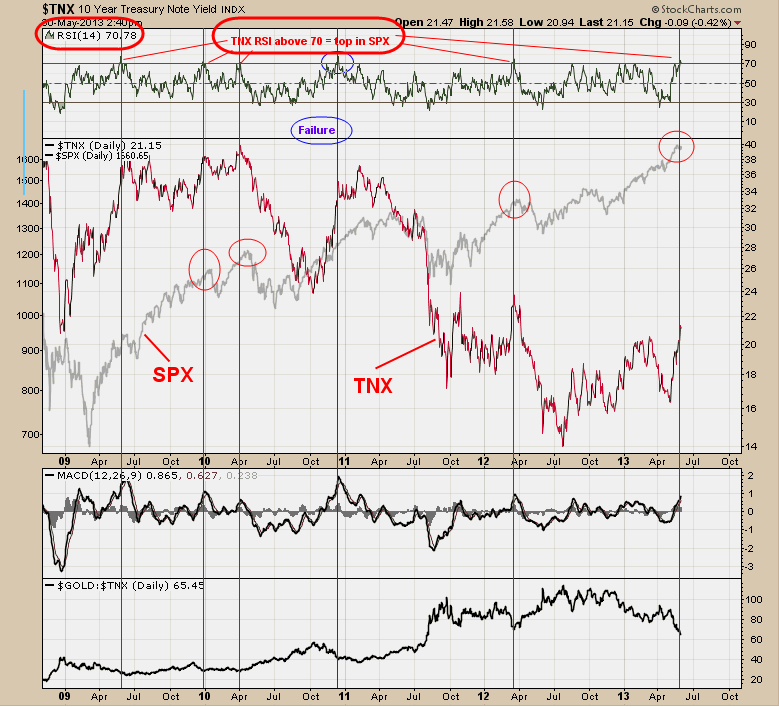
Above is the 10 year Treasury note yield (TNX) and in the back ground is the SPX. Over the last several years, surges in TNX where the RSI reached above 70 the SPX were near a high at least for the short term. The red vertical lines show when the RSI for TNX was above 70. There was a failure back in late December 2010 but the other signals where pretty close to a SPX high. Currently the RSI of TNX is 70.78 and suggests a high on the SPX is near. Strong support lies near 1600 and if market got there and ticks and TRIN closes came at bullish levels, it would setup a bullish signal. It appears at this point the market is in a consolidation pattern.
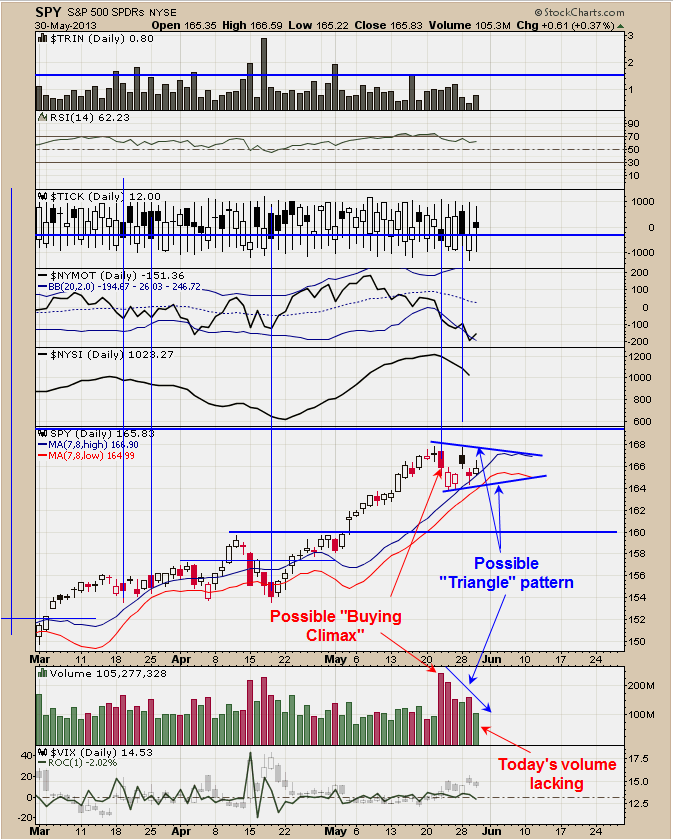
The pattern that could be forming short term is a “Triangle” pattern. A “Triangle” pattern moves towards an apex as the volume decreases and that appears is what is going on here. Last Wednesday’s high could have been a “Buying Climax” with its upside reversal and huge volume. The TRIN nor the Ticks closes right now are not giving a lot of information. Today’s attempted rally came on reduced volume and suggests the rally may fail short term. The market is due for a consolidation and that appears to be what is going on. Staying flat for now. 
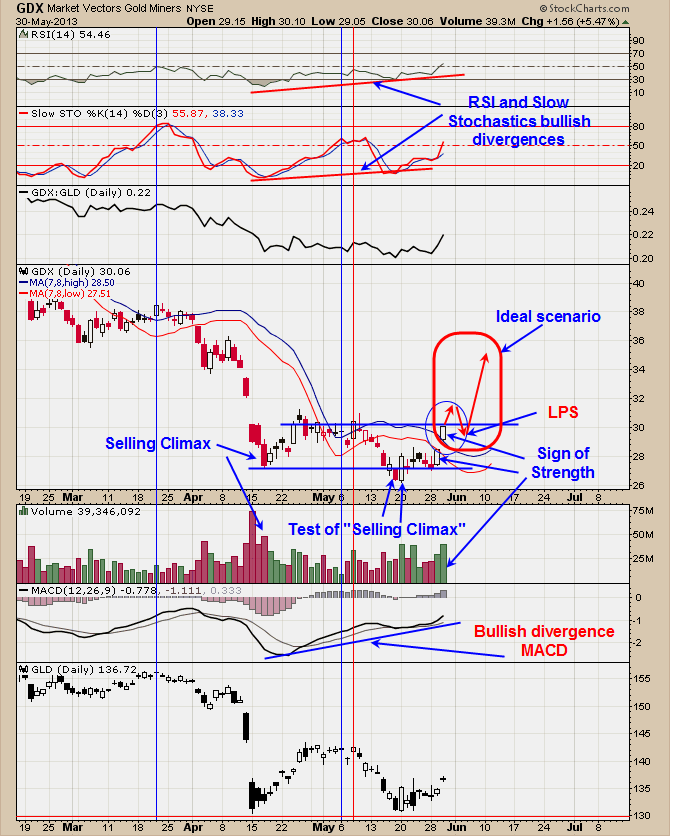
This dialog is a continuation from yesterday’s report as this bullish Wyckoff method is playing out to a “T”. We said yesterday, “In mid April, GDX produced a “Selling Climax” and on May 16, 17 and 20 trading tested on lighter volume and closed above the “Selling Climax” low showing the downtrend has exhausted itself. On May’s test of the “Selling Climax” low produced a positive divergence in the RSI, Slow Stochastics and MACD. Notice that a “Sign of Strength” (SOS) was produced on the rally back above the “Selling Climax” on May 20 and adds to the bullish reversal. Ideally we would like to see GDX break above 30 (the previous minor high) with a “Sign of Strength”, (this SOS is present on the last two day rally) than a minor consolidation back to 30 range and than another “Sign of Strength”.”…. “We would like to see this type of condition to continue above 30. The label “LPS” stands for “Last point of support” which is a Wyckoff term for the end of the bottoming process after which the uptrend begins.” There was a gap up today and the gap level may find support if tested and could be near our buy area. We will send out the buy signal if triggered.
Long NG at 5.14 on 10/8/12. Long GDX at 58.65 on 12/6/11. Sold SLV at 30.24 on 12/16/12 = gain 2.6%; Long SLV at 29.48 on 10/20/11. Long GLD at 173.59 on 9/21/11. Long GDXJ average 29.75 on 4/27/12 Long BRD at 1.67 on 8/3/11. Long YNGFF .44 on 7/6/11. Long EGI at 2.16, on 6/30/11. Long KBX at 1.13 on 11/9/10. Long LODE at 2.85 on 1/21/11. Long UEXCF at 2.07 on 1/5/11. We will hold as our core position in AUQ, CDE and KGC because in the longer term view these issues will head much higher. Holding CDE (average long at 27.7. Long cryxf at 1.82 on 2/5/08. KGC long at 6.07. Long AUQ average of 8.25.
