Earlier this week I received two requests for a different approach to my monthly update on the long term market trend, one that plots a regression through the fourteen decades of US market data. My intention is illustrate that the stock indexes do not move in a straight lines but are subject to long-term ("secular") trends. A linear regression through the complete series essentially finds a straight line that best 'fits' the monthly averages of daily closes, splitting the data points above and below the line.
Because the range of price data is so extreme, I use a log-scale vertical axis to ensure that advances and declines are the same relative size regardless of the price (e.g., a 33% decline will be the same vertical distance regardless of the price.
My standard regression-to-trend chart uses "real" (inflation-adjusted) prices chained in today's dollars. Here's the latest update using a base 10 log scale for the vertical axis and an exponential regression through the data: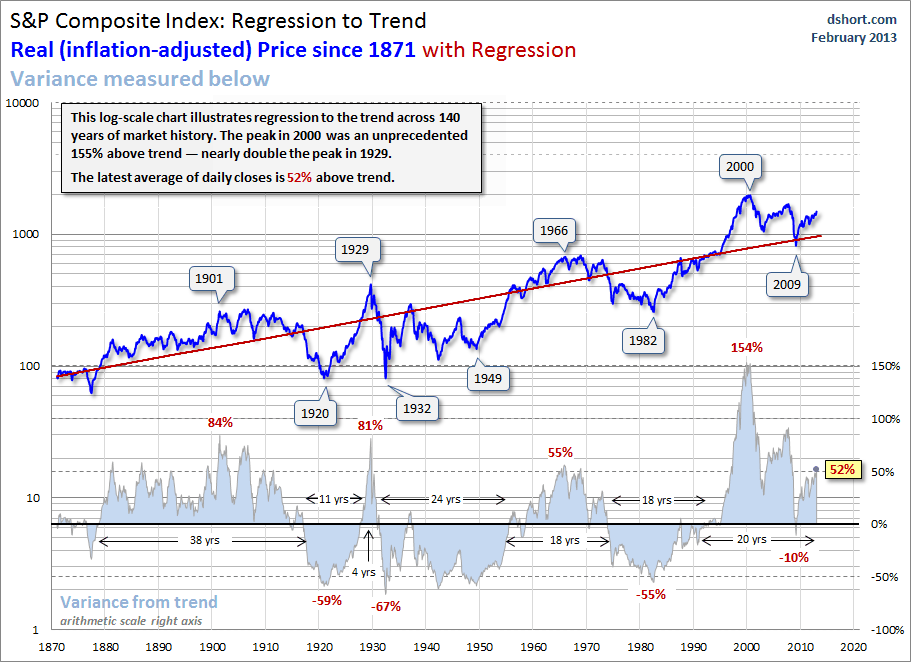
The two requests I received were for a regression through the nominal index data -- in other words, with no inflation adjustment. My personal view is that a nominal chart of 14 decades is dangerously misleading. Consider: A dollar in 1871 has about the purchasing power of a nickel today, and the slide in value has been incredibly erratic, especially in the decades before FDR abandoned the gold standard.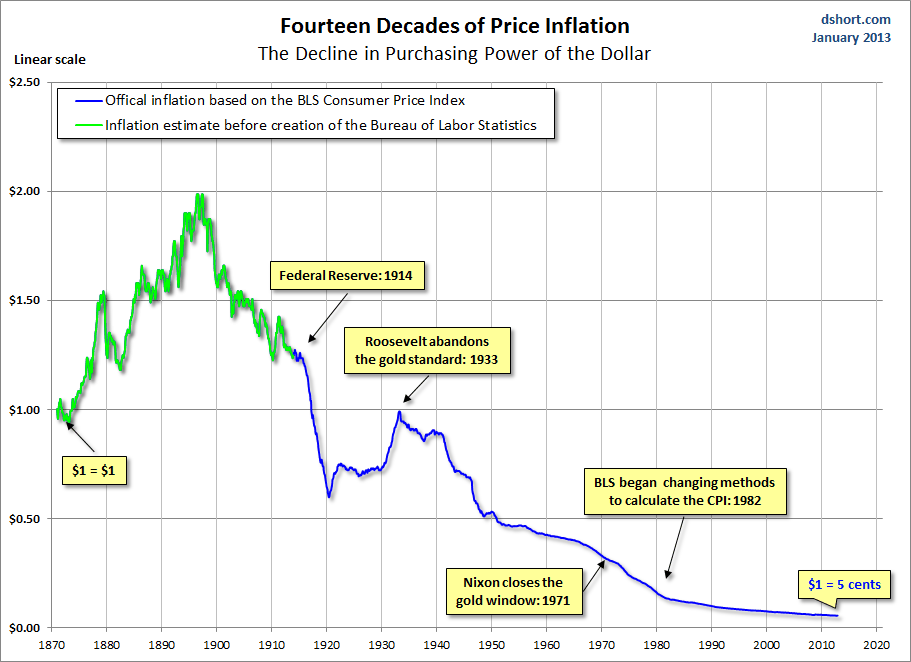
Here again is the real (inflation-adjusted) S&P Composite, this time using a base 2 log scale vertical axis with an exponential regression. With a base 2 log scale, Excel is able to plot more numbers on the vertical axis. I've included four callouts on the lower series, which illustrates the percent above and below the regression. The four numbers in red are the percent variance from the trend at the market peak in 1929, the trough in 1932, the Internet Bubble peak and the latest value as through January 2013: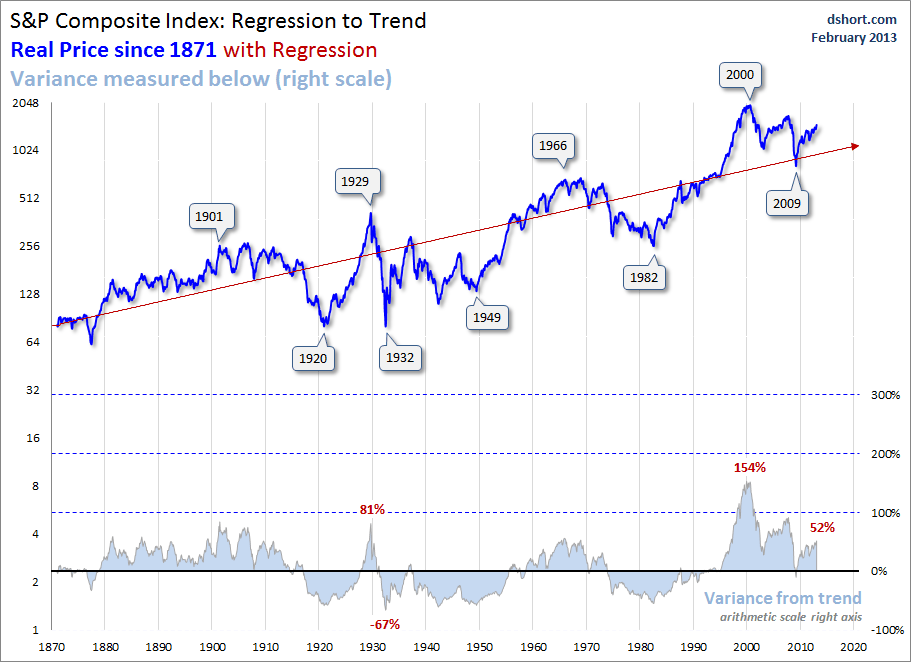
Here is the nominal version -- no inflation adjustment -- with the same four callouts on the lower series.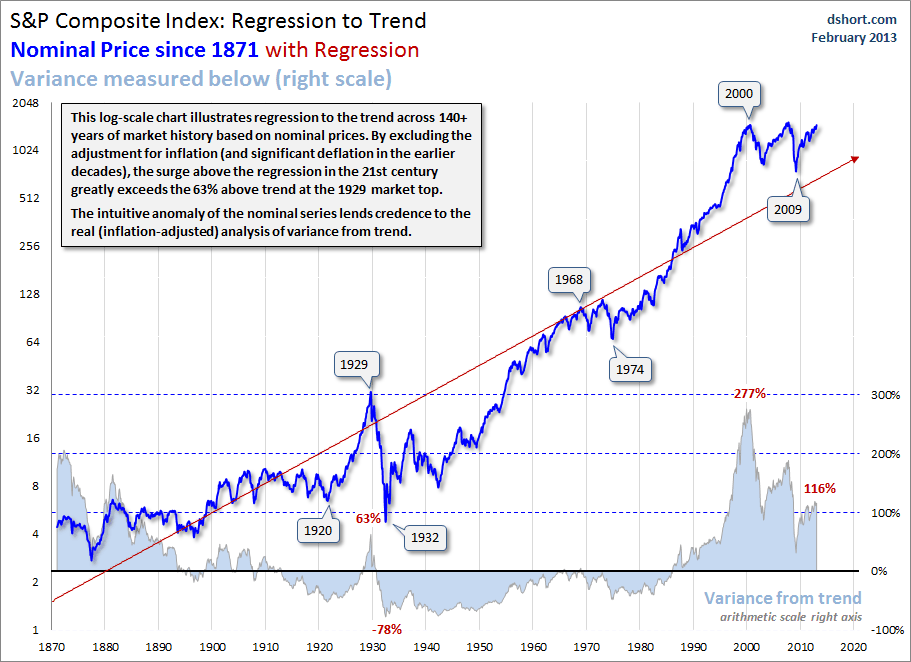
My view is that the current market price is significantly above trend, which suggests excess valuation. The nominal version of the chart puts that deviation from trend at a level that is clearly a nonsensical exaggeration of the overvaluation, hence my preference for the "real" data.
I'll close with an overlay of the nominal and real index, the latter chained in today's dollar value. And I've included the annualized rate of inflation (deflation) in the background.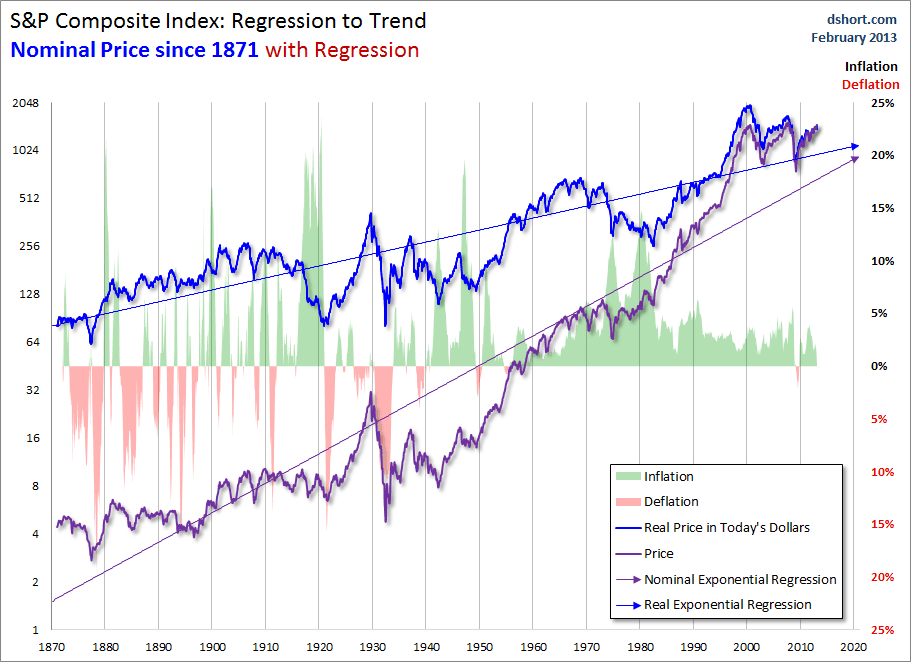
In a follow-up commentary, I'll explore the pros and cons of using two regressions, one for the earlier decades and another for the more recent decades, say since the introduction of the 401(k) and IRAs in the early 1980s.
Note: For readers unfamiliar with the S&P Composite index, see this article for some background information.
- English (UK)
- English (India)
- English (Canada)
- English (Australia)
- English (South Africa)
- English (Philippines)
- English (Nigeria)
- Deutsch
- Español (España)
- Español (México)
- Français
- Italiano
- Nederlands
- Português (Portugal)
- Polski
- Português (Brasil)
- Русский
- Türkçe
- العربية
- Ελληνικά
- Svenska
- Suomi
- עברית
- 日本語
- 한국어
- 简体中文
- 繁體中文
- Bahasa Indonesia
- Bahasa Melayu
- ไทย
- Tiếng Việt
- हिंदी
The Long Term Market Trend: What If We Ignore Inflation/Deflation?
Published 02/08/2013, 12:36 AM
Updated 07/09/2023, 06:31 AM
The Long Term Market Trend: What If We Ignore Inflation/Deflation?
Latest comments
Loading next article…
Install Our App
Risk Disclosure: Trading in financial instruments and/or cryptocurrencies involves high risks including the risk of losing some, or all, of your investment amount, and may not be suitable for all investors. Prices of cryptocurrencies are extremely volatile and may be affected by external factors such as financial, regulatory or political events. Trading on margin increases the financial risks.
Before deciding to trade in financial instrument or cryptocurrencies you should be fully informed of the risks and costs associated with trading the financial markets, carefully consider your investment objectives, level of experience, and risk appetite, and seek professional advice where needed.
Fusion Media would like to remind you that the data contained in this website is not necessarily real-time nor accurate. The data and prices on the website are not necessarily provided by any market or exchange, but may be provided by market makers, and so prices may not be accurate and may differ from the actual price at any given market, meaning prices are indicative and not appropriate for trading purposes. Fusion Media and any provider of the data contained in this website will not accept liability for any loss or damage as a result of your trading, or your reliance on the information contained within this website.
It is prohibited to use, store, reproduce, display, modify, transmit or distribute the data contained in this website without the explicit prior written permission of Fusion Media and/or the data provider. All intellectual property rights are reserved by the providers and/or the exchange providing the data contained in this website.
Fusion Media may be compensated by the advertisers that appear on the website, based on your interaction with the advertisements or advertisers.
© 2007-2024 - Fusion Media Limited. All Rights Reserved.
