We just closed the books on another month so it's time to pull back from the day-to-day and look at the longer timeframes. The Dow Jones Industrial Average (DJIA, DIA) gets a lot of attention from the media but generally not much from the trading world. Maybe in this time of reflection it makes sense to take a peek at what they are all so fired up about, but with a traders twist.
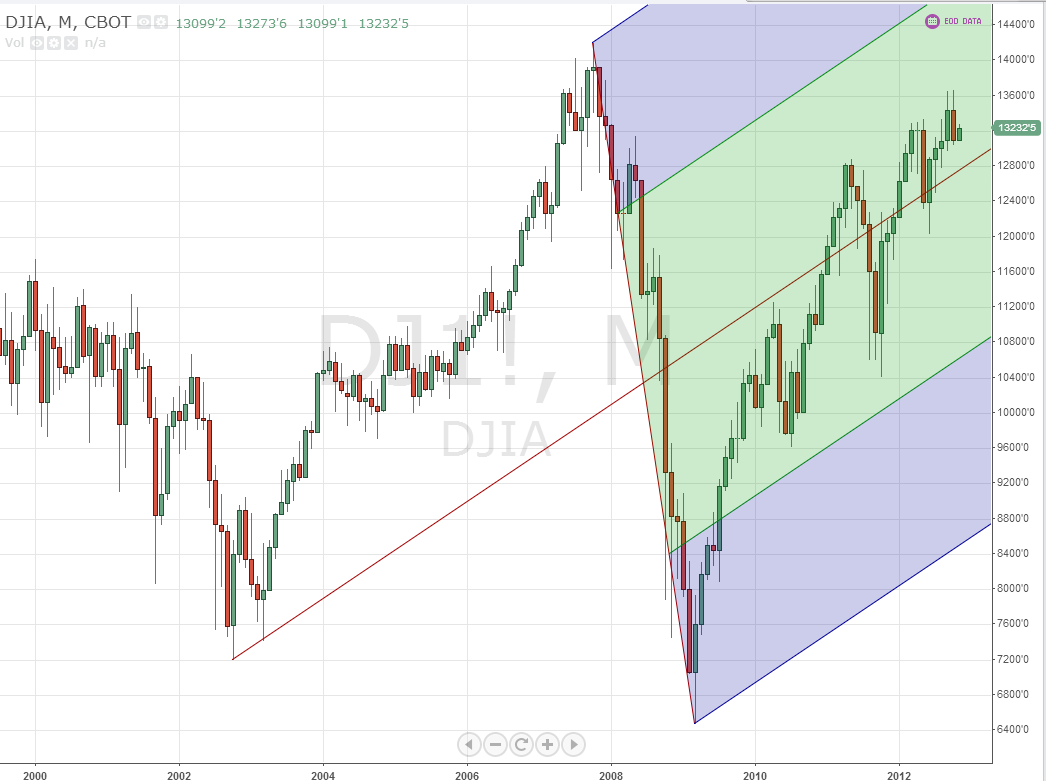
DJIA, Monthly, Andrew’s Pitchfork
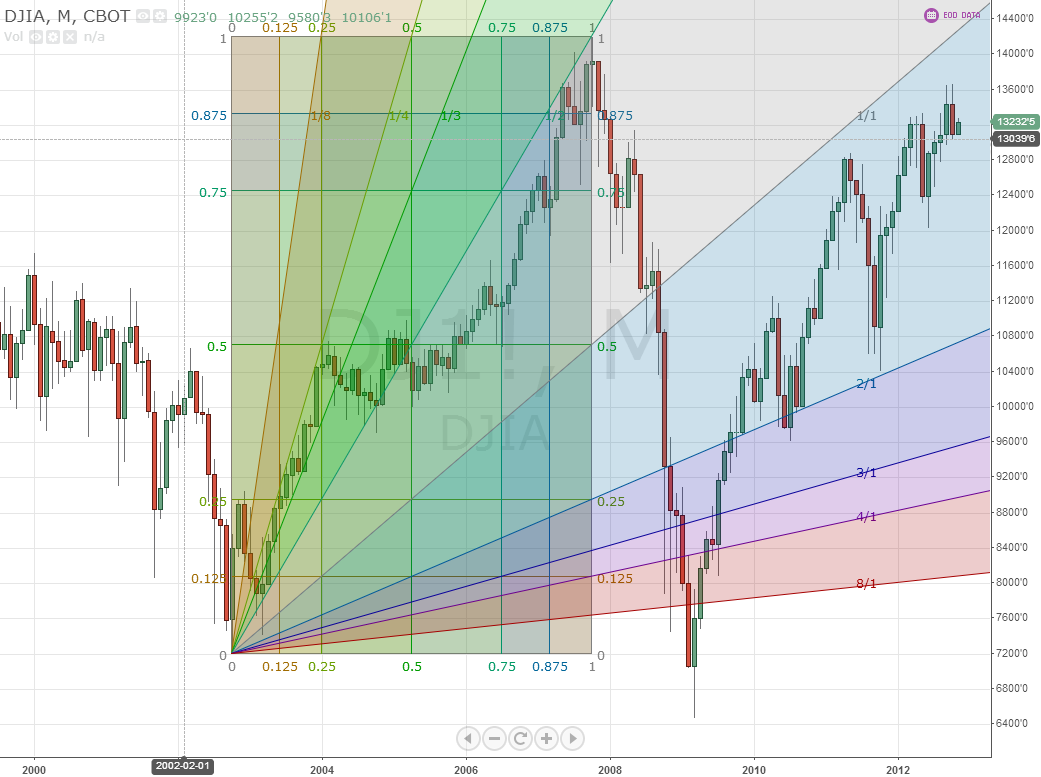
The long-term monthly chart of the Dow above shows the major rise from 2002 through 2007 and the fall into the 2009 lows. Using these endpoints a bullish Andrew’s Pitchfork emerges. The red Median Line is just below the current price at 12813, and so a pullback to that level is not out of the question as it attracts price lower, but the clear trend is higher. If you shift to the chart below of the Gann Square and Fan Lines you can see that after the extreme event of the 2009 low it has been moving back toward the 1/1 line tightening the cone along the way with support with touches at the 2/1 line.
DJIA, Monthly, Gann
The 1/1 level above at 14312 in November puts a bound on the upper side. 12813 to 14312, is quite a large range. But definitely bullish in the long term.
The information in this blog post represents my own opinions and does not contain a recommendation for any particular security or investment. I or my affiliates may hold positions or other interests in securities mentioned in the Blog, please see my disclaimer page for my full disclaimer.
Original post
- English (UK)
- English (India)
- English (Canada)
- English (Australia)
- English (South Africa)
- English (Philippines)
- English (Nigeria)
- Deutsch
- Español (España)
- Español (México)
- Français
- Italiano
- Nederlands
- Português (Portugal)
- Polski
- Português (Brasil)
- Русский
- Türkçe
- العربية
- Ελληνικά
- Svenska
- Suomi
- עברית
- 日本語
- 한국어
- 简体中文
- 繁體中文
- Bahasa Indonesia
- Bahasa Melayu
- ไทย
- Tiếng Việt
- हिंदी
The Long-Term Dow
Published 11/02/2012, 10:50 AM
Updated 05/14/2017, 06:45 AM
The Long-Term Dow
3rd party Ad. Not an offer or recommendation by Investing.com. See disclosure here or
remove ads
.
Latest comments
Install Our App
Risk Disclosure: Trading in financial instruments and/or cryptocurrencies involves high risks including the risk of losing some, or all, of your investment amount, and may not be suitable for all investors. Prices of cryptocurrencies are extremely volatile and may be affected by external factors such as financial, regulatory or political events. Trading on margin increases the financial risks.
Before deciding to trade in financial instrument or cryptocurrencies you should be fully informed of the risks and costs associated with trading the financial markets, carefully consider your investment objectives, level of experience, and risk appetite, and seek professional advice where needed.
Fusion Media would like to remind you that the data contained in this website is not necessarily real-time nor accurate. The data and prices on the website are not necessarily provided by any market or exchange, but may be provided by market makers, and so prices may not be accurate and may differ from the actual price at any given market, meaning prices are indicative and not appropriate for trading purposes. Fusion Media and any provider of the data contained in this website will not accept liability for any loss or damage as a result of your trading, or your reliance on the information contained within this website.
It is prohibited to use, store, reproduce, display, modify, transmit or distribute the data contained in this website without the explicit prior written permission of Fusion Media and/or the data provider. All intellectual property rights are reserved by the providers and/or the exchange providing the data contained in this website.
Fusion Media may be compensated by the advertisers that appear on the website, based on your interaction with the advertisements or advertisers.
© 2007-2024 - Fusion Media Limited. All Rights Reserved.
