U.S. large company stocks may be celebrating the anticipation of rate cuts. After all, the S&P 500 has been toying with record highs. Yet a broader view demonstrates that the asset class is struggling more than advertised.
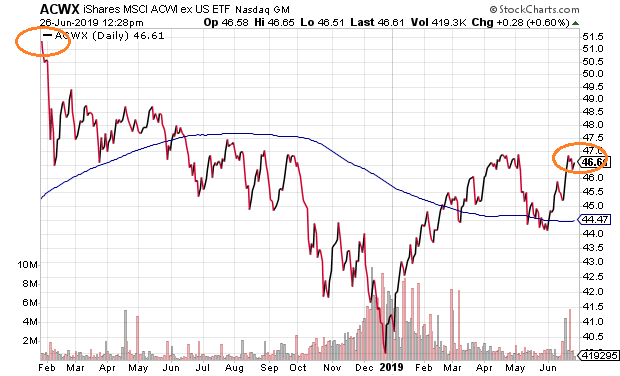
For example, diversified investors might be aware of world index funds that exclude the U.S. In particular, the iShares MSCI ACWI ex U.S. (NASDAQ:ACWX) sits in correction territory, nearly 10% below its January 2018 peak.
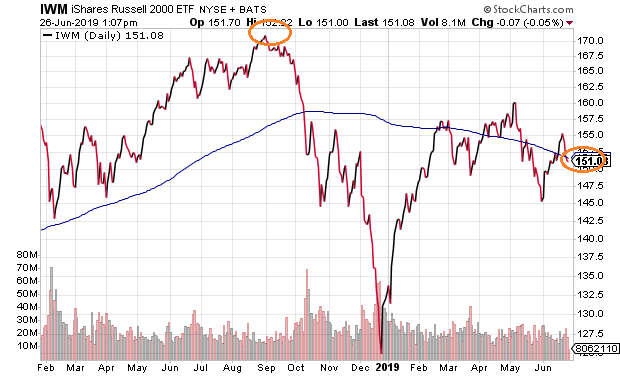
What about the Russell 2000 – an index that measures the performance of 2000 smaller American corporations? The iShares Russell 2000 ETF (NYSE:IWM) resides approximately 11.5% below its high-water mark from September. What’s more, the negative slope of its moving average suggests that smaller company stocks are still stuck in a downtrend.
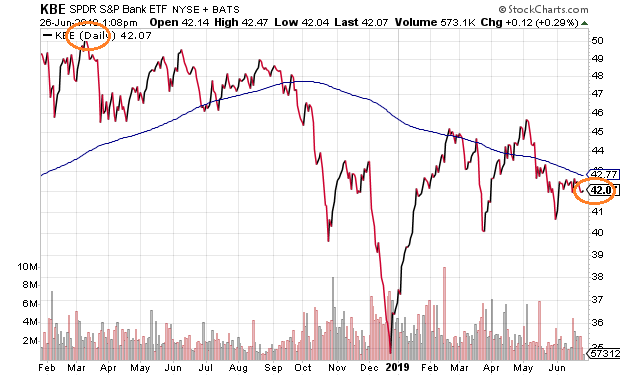
Even within the large-cap arena, several influential segments have been signaling trouble ahead. For instance, the banking sector has been trending lower since October of 2018. Additionally, the price of the SPDR S&P Bank ETF (NYSE:KBE) is 16% below a March 2018 pinnacle.
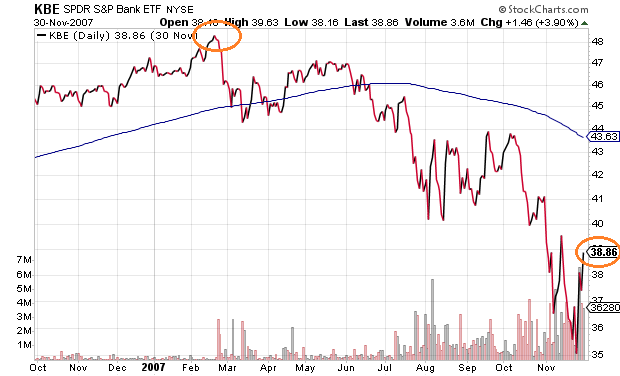
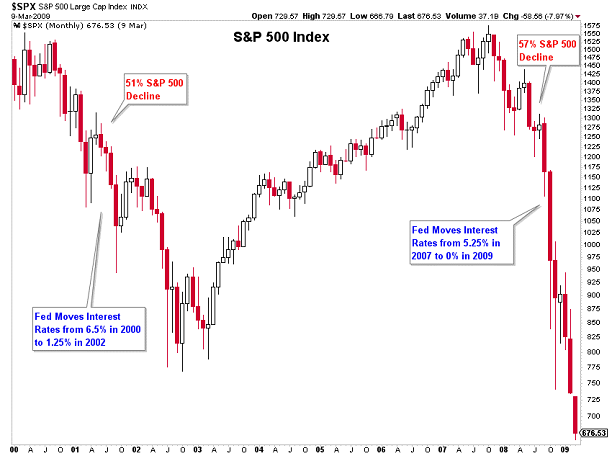
There may even be similarities between today’s price movement and the price action leading into the 10/2007-3/2009 stock bear. Back then, bank stocks had been dropping precipitously, even as the S&P 500 had pushed higher into record territory.
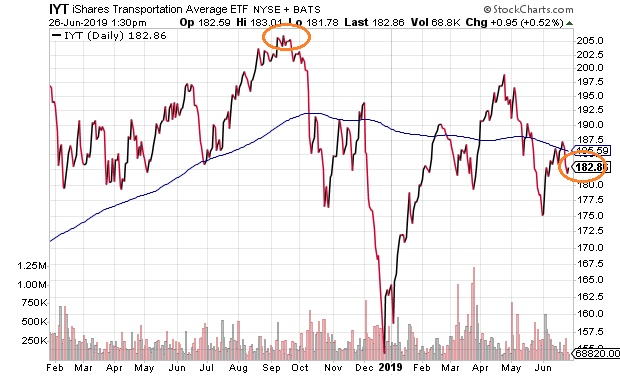
There has been noteworthy weakness in the all-important transportation sector as well. The iShares Transportation Average ETF (NYSE:IYT) — a fund that tracks investment results of airline, railroad and trucking companies — toils 11% below its September 2018 pinnacle.
Transportation stocks may be a leading indicator of economic well-being due to the role that transporters play in the movement of goods. The downturn within the segment, then, is not a good sign.
Inconvenient truths about the entire stock landscape may be irrelevant for those who focus exclusively on the performance of the S&P 500. For others, however, caution may be warranted.
Consider the reality on pre-tax corporate profits. They actually topped out in the 3rd quarter of 2014.
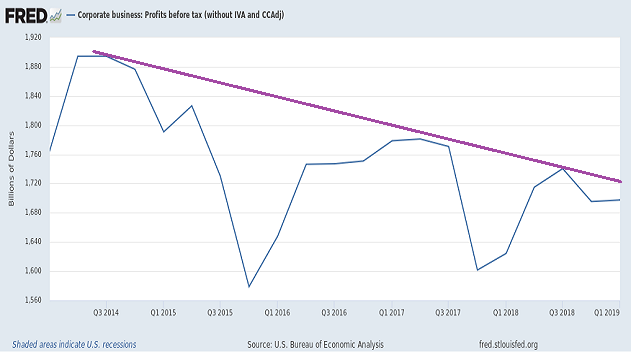
Granted, corporate tax reform dramatically improved after-tax profits. Similarly, companies used billions of borrowed dollars from the debt markets to buy back shares in the equity markets, inflating the ever-popular earnings per share (EPS) metric.
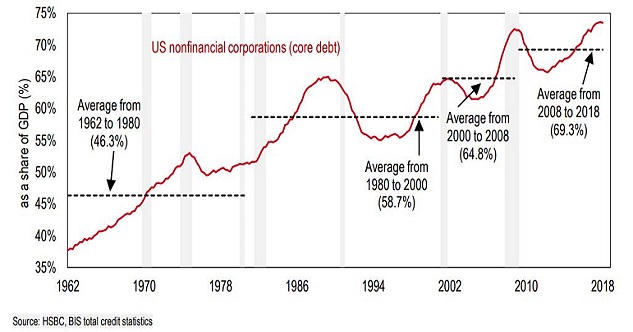
That said, the pop from tax reform has already been accounted for, while companies have been approaching peak debt levels. Gross leverage, debt-to-GDP, debt-to-revenue – these traditional metrics suggest that we are in the late stages of the credit cycle. In particular, leverage peaks tend to be followed by retrenchment.
Some will tell you that ultra-low interest rates have put companies in better position to service debts than in previous decades. Some would even have you believe that the precipitous decline of the 10-year Treasury yield over the last six months implies that corporations will be even better equipped than they were back in October.
The problem with this line of thinking? For one thing, it assumes that borrowing costs for all corporations become more favorable when Treasury bond yields move lower. In truth, as recessionary pressures build, yield spreads widen. And no matter how little Treasury bonds may offer, below-investment-grade borrowers could find themselves with higher interest expenses on their massive debt piles.
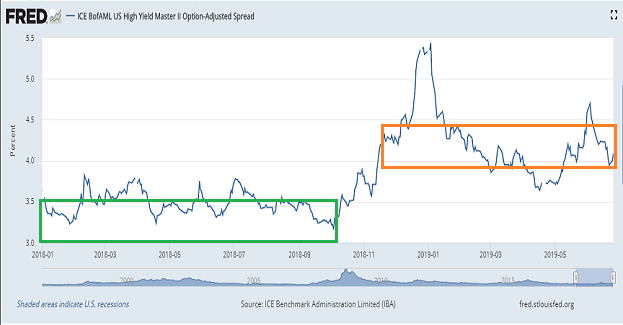
To illustrate this point, one can look at high-yield corporate bond spreads with comparable Treasuries. Borrowing costs for riskier corporations may still be favorable at this moment. Yet the wider spreads imply that the corporate borrowing costs are not much better than they were in 2018, even as the 10-year yield has fallen from the 3% level to the 2% level. (Yield spreads and corresponding high yield borrowing costs might even spike dramatically higher, even if Treasury bond yields continue to fall.)
The other problem in believing that the 10-year yield’s descent is great for corporations? It comes with an assumption that companies will continue generating equal or better profits alongside those lower rates. In truth, the 10-year yield’s decline may be signaling an economic slowdown that would hurt revenue and earnings.
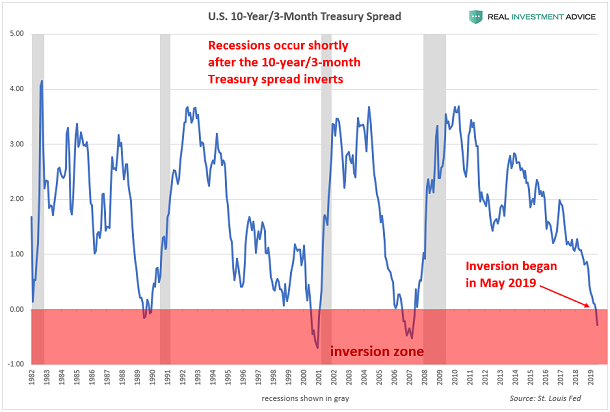
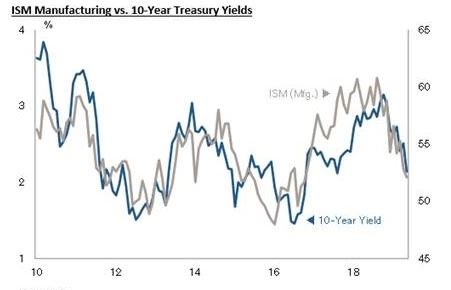
We can see the increasing likelihood of recession in the ongoing inversion of the yield curve that has preceded every recession since World War II. We can also see it in the correlation between the 10-year yield and the ISM Manufacturing Survey.
Still, there are those who think central bank easing can solve everything. If that is truly the case, if ever-lower rates are always stimulative, why haven’t German stocks and Japanese stocks surged on sub-zero interest rates?
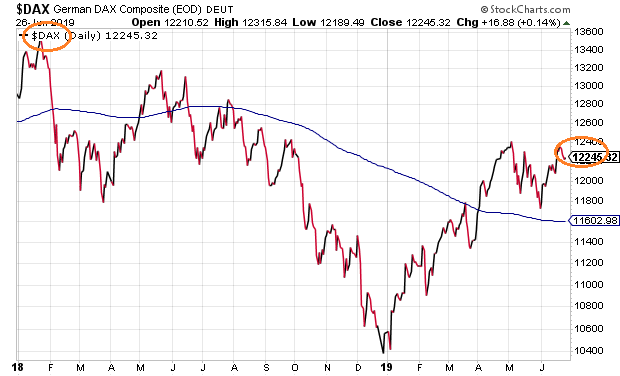
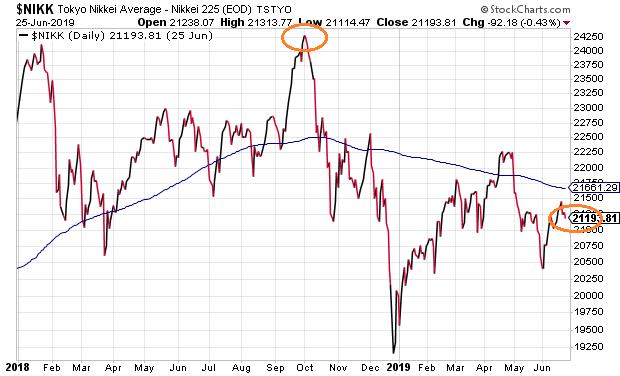
A simplistic answer to that question might be that the pervasive use of negative interest rate policy in Europe and in Japan makes investors hesitant to invest. Along the same lines, though, one is left to ponder the point at which lower U.S. Treasury yields would fail to impress U.S. stock market participants.
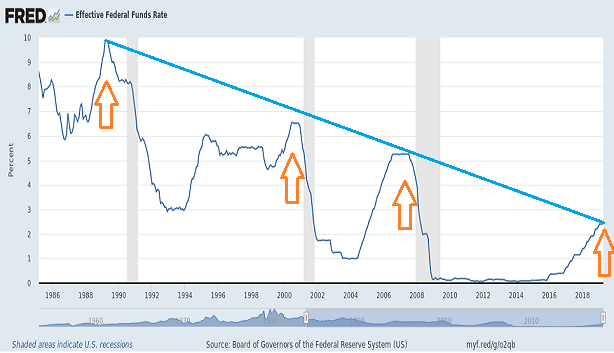
It is worth remembering that we’ve been here before. The U.S. Federal Reserve maintains easy money policies for an extended period. It tightens the reins for a relatively short span. It flips to a neutral stance for a bit, before eventually slashing its overnight lending rate to levels markedly lower than the previous credit cycle. Yet the cuts that follow the tightening phase fail to prevent recession and fail to prevent stock mayhem.
The sensible course of action? Maintain a lower risk profile than you might otherwise carry.
Disclosure: Gary Gordon, MS, CFP is the president of Pacific Park Financial, Inc., a Registered Investment Adviser with the SEC. Gary Gordon, Pacific Park Financial, Inc, and/or its clients June hold positions in the ETFs, mutual funds, and/or any investment asset mentioned above. The commentary does not constitute individualized investment advice. The opinions offered herein are not personalized recommendations to buy, sell or hold securities. At times, issuers of exchange-traded products compensate Pacific Park Financial, Inc. or its subsidiaries for advertising at the ETF Expert web site. ETF Expert content is created independently of any advertising relationships.
