
Are we in the midst of an "Enchanted April"? No, not the absorbing 1992 Miramax film some might characterize as a so-called "chick movie", wherein the exquisite cinematography all around Italy's Riviera Ligureis nothing short of stunning. Rather, we're referring to the notion put forth on occasion out there by the PMS ("Precious Metals Scrutineers") that April is considered a seasonally good performance month for gold. And with the yellow metal having settled out the week yesterday (Friday) at 1240, given all the numerous expectations for price to instead drop sub-1200 so as to at least test the 1190s, this month's enchantment is perhaps keeping Gold somewhat levitated ... so far anyway as we're only one week along April's way. But at the end of the day, per the below display, it may be 'tis only the good Aprils past that are memorable in the minds of Gold Bulls whilst the balance are forgotten "cudda-beens". To wit, here are gold's percentage changes for every April since the turn of the millennium; and as you can see, post the All-Time High year of 2011, Aprils since have been duds to downers:
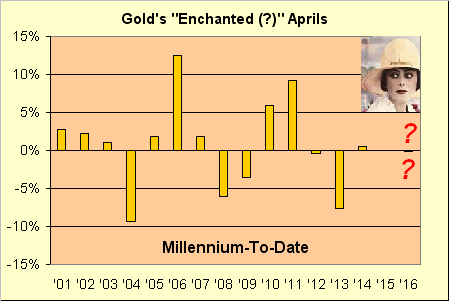
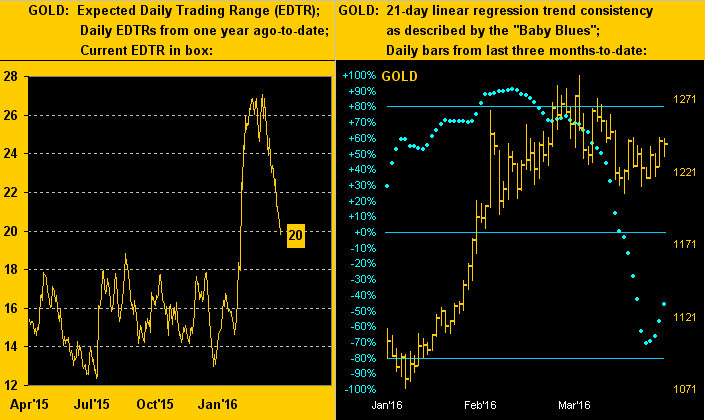
'Course what's not reflected in the above graphic is thus far this April, and really since late March, gold has being getting grabbed up time-and-again on relatively lackluster selling. In fact, through these first 14 weeks (already!) of 2016, Gold on a points basis has had but three double-digit down weeks and six double-digit up weeks. Still technically, 'tis been the 1240-1280 resistance zone that has expectedly held Gold in check, despite price presently being up year-to-date 16.9% and continuing to be far and away the strongest of our eight markets that comprise BEGOS (Bond, Euro/Swiss, Gold/Silver/Copper, Oil, S&P) as we herein saw per their standings through Q1 one week ago. Yet similar to the mise-en-scèneof the above referenced film, gold too these last few weeks seems somewhat frozen in time. This is personified in the following two-panel chart. On the left we've gold's EDTR ("expected daily trading range") as charted from one year ago-to-date: the plunging line of late is indicative of the narrowing daily trading range. On the right is our familiar chart of gold's daily bars for the past three months-to-date: the most recent bars are simply bunching and/or basing, sufficiently so that our "Baby Blues" (the day-by-day consistency measure of the ongoing 21-day linear regression trend) have begun to curl back up:
Now for a bit of a surprise in next turning to gold's weekly bars, wherein we see price continuing to tickle the underbelly of that 1240-1280 resistance zone. Note too that the squeeze of the ascending parabolic blue dots is practically up to 1200 itself; in a week's time, (barring Gold first tripping the 1199 level), they'll be around 1210. Therefore: Gold can try to evade them by re-entrapping itself up in the murk of the resistance zone, else eventually fall prey to them within a week or two. But: take a good close look at this graphic, for what therein has just perceptively changed?
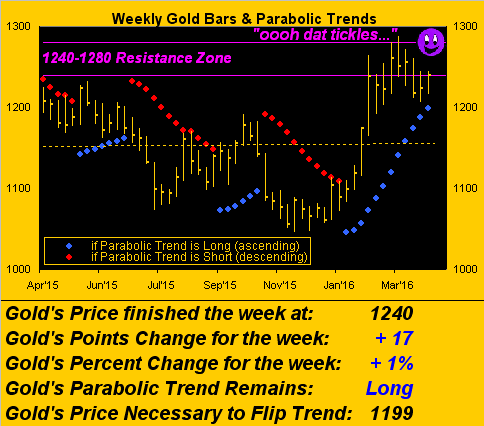
"I see it, mmb! The dashed line is not going down!"
Not only is that linear regression trend line not going down, Squire, rather 'tis rising for the first time since 19 September 2014 (81 weeks ago), when gold whilst down at that point year-over-year, had put in enough up-thrust en route to actually post a positive trend line. Now, the teeter-totter is at long (pun intended) last rising on the Bulls' side. And given the general decline in price across the left side of the above chart versus the increase on the right, should gold not plunge over the ensuing weeks/months, look for this trend line to take on more upside steepness. Doth turn the tide.
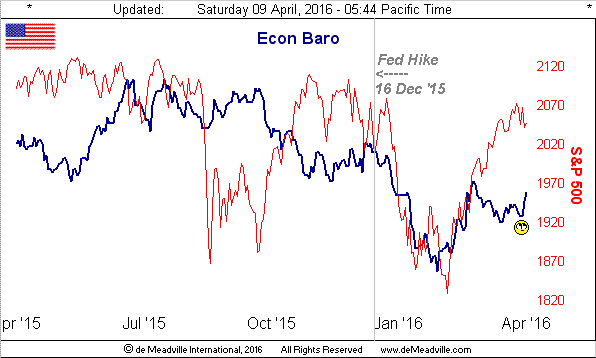
As for the economic tide, there was little input this past week for the Economic Barometer. You can below see the rightmost up-kink, which belies the decline in factory orders and the deepening trade deficit. Said negative data was more than mitigated by the improving Institute for Supply Management ("ISM") services reading, growth in consumer credit, a working off of wholesale inventory levels, and reduced first time claims for unemployment benefits. Life is good:
As to just howgood will be further revealed in the new week, the incoming data to include that on inflation, retail sales, manufacturing in the great state of New York, sentiment as figured by the academicians at The University of Michigan -- and amongst it all -- the Federal Reserve Bank's "Tan Tome" come Wednesday.
Deeper still in the economic midst, Thursday found Janet Yellen on the dais alongside former FedHeads Pauly, Benny and a streamed-in Ally, the current Fed Chair defending her Open Market Committee's decision to up their FedFunds target rate to 0.5% this past 16 December. Better still, we were told that we can calm our fears over recession. But again, don't tell that to Christine Lagarde: the Managing Director of the International Monetary Fund is, in encore, encouraging economic reform in the expectation of declining IMF forecasts on the horizon. Or as a CNN piece queried this past week: "Has the Fed messed up? "Moreover, as Gold's ole pal Al Edwards of Société Générale (PA:SOGN) chimed in too on Thursday, a StateSide recession is "imminent". By the above Econ Baro, 'twould appear we've already been in recession since at least last October, (not that 'tis the first time 'tis been pointed out).
Then there are the usual "keep 'em pumped" pieces out there, such as one from the Dow Jones wires last Monday entitled "4 Reasons Dow Headed Toward 20,000 By the End of the Year". 'Twill be a hoot to see that unfold should the S&P 500 (2048 at yesterday's close) reach our target for the year in the low 1400s. And for those of you who've not stopped by the website's S&P Moneyflow link, the quarterly flow (last 63 trading days) suggests the S&P ought now be now 100 points lower at 1948. 'Course, our "live" price-to-earnings ratio of 39.2x still suggests the Index ought be halved. But wait, there's more: guess what starts this coming week? Q1 Earnings Season, the truth of which also you can track at the website. Ain't honest arithmetic wonderful?
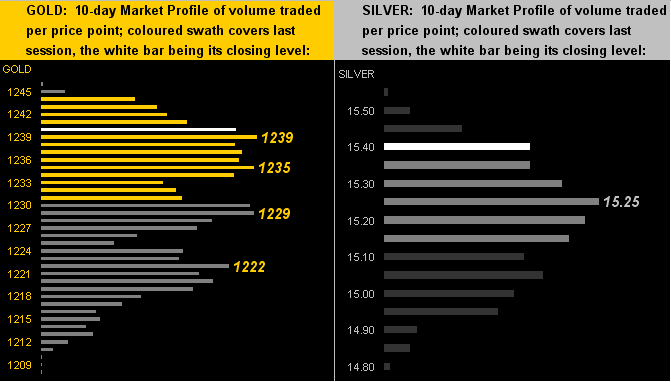
Wonderful as well is the supportive stance of gold's 10-Market Profile, below on the left, with that for Sister Silver on the right:
In closing we've these three quick notes
■ You've likely read that in response to folks pulling out tens-of-thousands of bucks at a time from its ATMs, JPMorgan Chase (NYSE:JPM) is now limiting such withdrawals for non-customers to a wee $1,000/day. Having started my banking career as teller with the BNP, cash withdrawals of $10,000 and up required (per IRS Publication 1544) an on-the-spot filing at the teller's window of Form 8300. One wonders if the ATMs dispense said Form along with the dough. In a world of unqualified people ascending into supervisory/managerial positions, I doubt it. But when the gold dispensaries show up, you can bet so will the IRS.
■ Ahhh, those Golden Moments post infant birth. In a nutshell, California allows both mums and dads six weeks of paid bonding leave at 55% of wages/salaries. But here in the San Francisco Enclave of Tyranny, the other 45% of pay also now must be doled out by private firms. 100% paid maternity leave for mum and dad. (There goes the condom biz).
■ Finally, speaking of our once fair city, I shall be escaping said foul locale in a week's time such that the next gold Update shall be a rather abbreviated "on-the-fly" piece. Short but sweet, as it were, for heaven forbid we ever leave you in the lurch out there. (At least not until Gold 2000!)
"Enchanted April" indeed: the IRS expects your share by Friday. Have a nice day. And for goodness' sake, avoid having to convert your gold!