BOO! Scared ya, eh? Well after all, 'twas Halloween, 'tis COVID Part Deux, and 'tis the StateSide Election.
Greetings once again from the high country up here in Squaw Valley, where time is at a premium as we're "in motion" as well, so let's get straight to it as Gold & Co. are on election go!
The notion inherit of our prior two missives remains intact: that a Team Red election victory is "priced into the market". Rather were the tilt be to Team Blue, as we'd penned "...Gold would by now have soared and the stock market by now have been floored..." 'Course the latter we deem as overdue to get floored regardless of election outcomes; and the S&P 500's pullback this past week of -5.6% is hardly a flooring: our "live" price/earnings ratio of 46.3x for the S&P remains historically extreme and as such unsustainable. Double the earnings, else halve the prices. And the likely catalyst thereto? Rising debt yields (and taxes too!), albeit they've materially yet to really appear; but demand for dough ultimately makes 'em go. Indeed, BlackRock (NYSE:BLK) sensing a Team Blue victory just downgraded their view on U.S. Treasuries: lower prices = higher yields should fiscal policy run further afield.
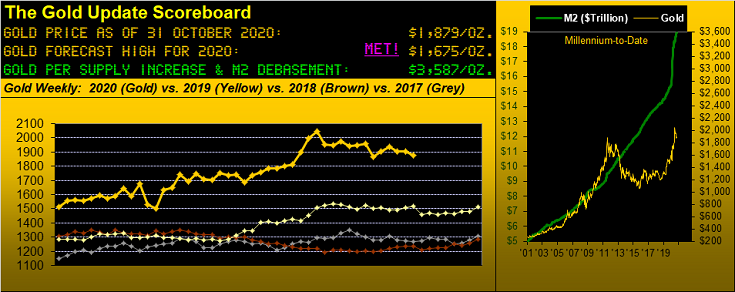
As for Gold, there's no "election fear trade" whatsoever, price settling out the week Friday at 1879, (-1.3%). And of course broadly as we've also been penning, Team Gold stands to be the real election winner, yet less acceleratively so by a Team Red victory. But be the victors Blue or Red, mind the above Gold Scoreboard's valuation, at present 3587: 'tis destiny for the yellow metal (and the Gold holder's wherewithal); the only incalculable bit is how swiftly price moves up there.
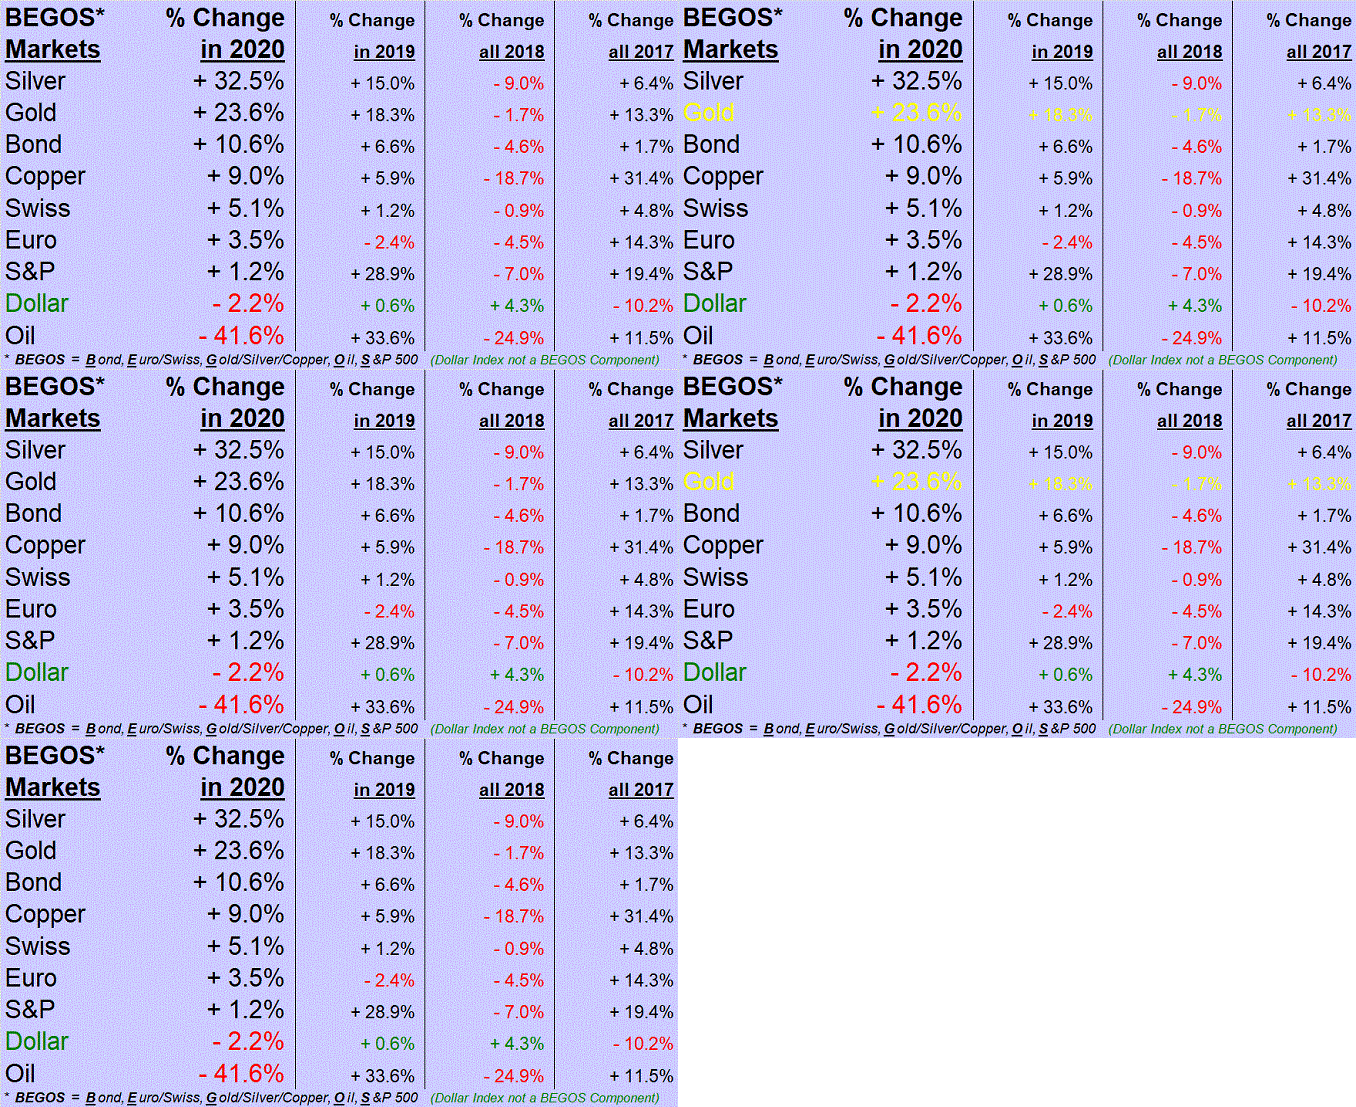
Regardless of "The When", it being another trading-month's end, here we go with our BEGOS Markets Standings through October of 2020, still substantially led by Silver +32.5% and Gold +23.6%. The stock market as measured by the S&P 500 is but +1.2 after a full year's rise of +28.9% in 2019; and still scraping the bottom of the barrel (after being +33.6% in 2019) is Oil -41.6%:
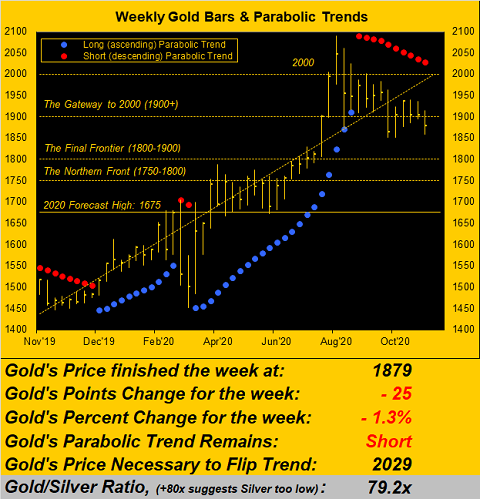
Next in going year-over-year we've Gold's weekly bars, the parabolic Short trend for which now numbers ten weeks in duration per the descending red dots. Again however, the pattern of the five rightmost bars appears more consolidative than negative. Indeed to reemphasize that which we'd regularly pointed out better than a month ago, Gold's price by our structural view is safe above 1830. And most obvious by the dashed regression line, price's broader trend remains firmly in ascent:
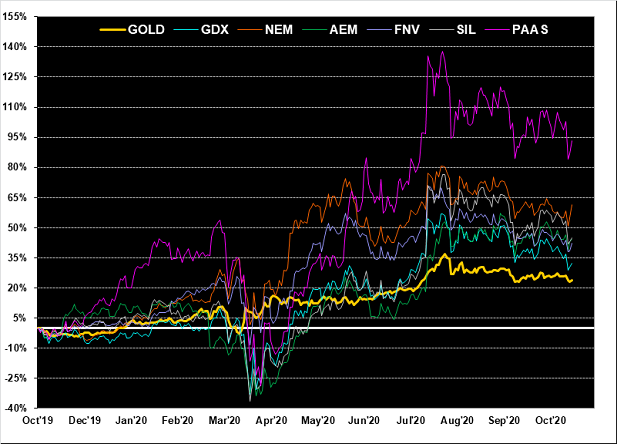
As well from this date one year ago, let's go to Gold's percentage performance vis-à-vis some of the best of its equities brethren. Up the "least" is Gold itself +24%, ascendingly led by the VanEck Vectors Gold Miners exchange-traded fund (GDX (NYSE:GDX)) +32%, Franco-Nevada (FNV) +42%, Agnico Eagle Mines (NYSE:AEM) +44%, the Global X Silver Miners exchange-traded fund (SIL) +45%, Newmont (NEM) +61%, and "from worst to first" Pan American Silver (NASDAQ:PAAS) +93%. (Comparatively, should you be scoring at home, the yield for the S&P 500 is 1.758% whilst that on the U.S. 10-Year Treasury Note is +0.860% -- neither of which may be "safe" as initially planned in bubble-land). Here's the precious metals' mix:
Economy-wise, (no surprise), StateSide Q3 Gross Domestic Product notched the foresought +30% annualized growth shot, the initial reading being even better at +33.1%. This whirl 'round somewhat stands to reason after having the Q2 economy turned off such as to elicit a GDP rate plunge of -31.4%: "... clap OFF ... clap ON ..." 'Course, much of the service companies continue to suffer, let alone sadly succumb.
Similarly for the EuroZone, following a Q2 GDP decline of -12.1%, Q3 brought about an increase of +12.7%. But 'tis feared with COVID restrictions being renewed as new infections are accrued that the EuroZone's economy shall further falter to that StateSide, making it all the more curious as to how the Euro can continue to exhibit comparative strength over the Dollar, (the rate at present $1.1658/€ which as noted in the above standings is +3.5% year-to-date). 'Course, the "M2" supply increase of Euros so far this year is about +9% whereas that for the Dollar is about +23%: one might thus opine that the Euro vis-à-vis the Dollar is "getting worse more slowly." (Reprise: Gold year-to-date is +23.6%; Silver is +32.5%).
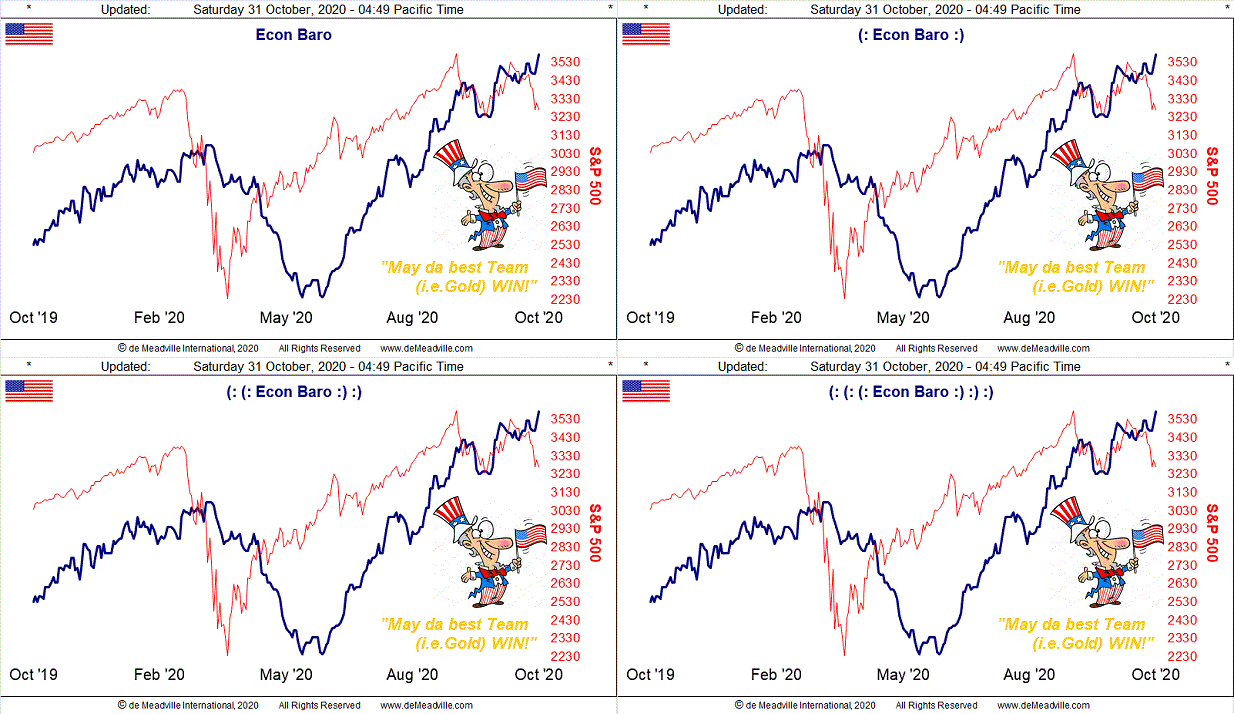
Meanwhile, public sectors 'round the world are all a-jitter as economic slowings produce less taxation glitter. Thus beware those future fiscal follies! As for the StateSide Economic Barometer, its oscillative rebound has clearly beaten its COVID letdown, but with more infections and now the critical elections directly in the balance, be it Team Red or be it Team Blue, 'tis by Team Gold one's wealth may best accrue. We'll see in the ensuing week, too, if the Federal Open Market Committee has anything further to throw into the stew:
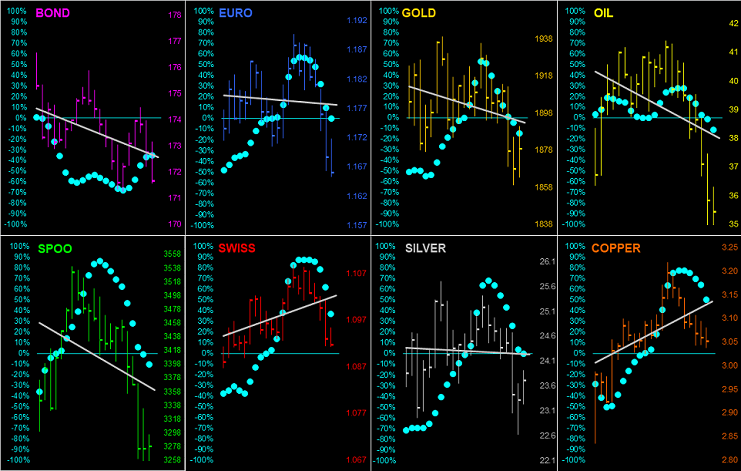
So with Gold & Co. on election go, let's go 'round the horn across the last 21 trading days (one month) for each of the BEGOS Markets eight components. Save for the Bond (barely), the baby blue dots of linear regression trend consistency are in decline for the balance of the bunch, such trends specifically denoted by the grey diagonal lines. A lot of "over the falls" looks in this graphic:
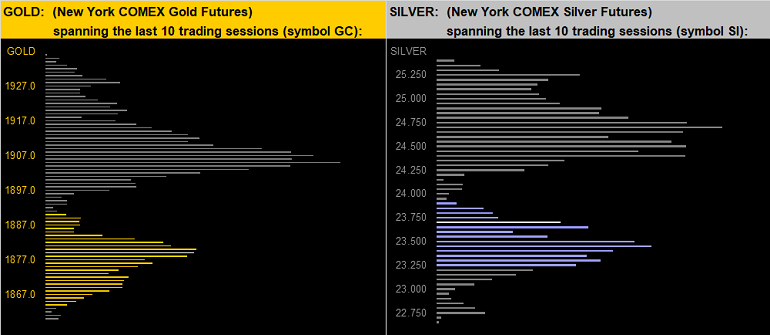
As for the precious metals' price-by-volume points over the last fortnight, here they are for Gold on the left and for Silver on the right. For the yellow metal, the two main price clustering areas are at 1905 and 1879, whilst for the white metal her two most dominant trading apices are at 24.70 and 23.45. As well for those of you who track the website's Market Magnets (each profile's volume-weighted average price), 'tis at present 1899 for Gold and 24.24 for Silver:
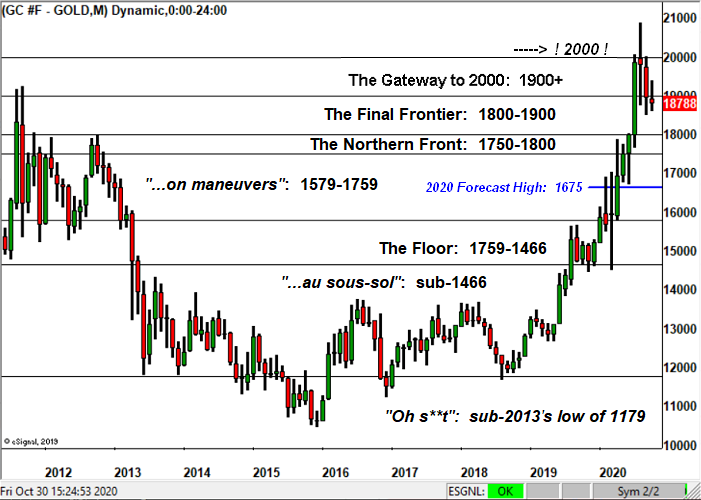
Toward closing, here is our structural view of Gold by its monthly bars across the past nine years: quite the ascent we've seen, non? And yet by debased Dollar valuation, we sense so much more ascent to go:
With but two trading days to finally be pre-election positioned, our apolitical reiteration remains for the StateSide incumbent to be re-elected, even if for no other reason than 'tis "priced into the market". 'Course what was once one of the most widely-respected financial publications on the planet, Barron's, sees it the other way 'round: "The Market Is Betting Trump Will Lose the Election." Fair enough as in markets, one entity needs another to take the other side of the trade. But be it Team Red or be it Team Blue, broadly a stock market decline ought ensue, especially should yields rise anew, whilst Team Gold ultimately wins in our view -- and with a Silver bow too! BOO!