Get 40% Off
💰 Buffett reveals a $6.7B stake in Chubb. Copy the full portfolio for FREE with InvestingPro’s Stock Ideas toolCopy Portfolios

The First Signs Of Buying On WTI Daily Chart

Published 03/02/2020, 07:29 AM
Updated 07/09/2023, 06:31 AM
CL
-
WTI Oil Daily Chart

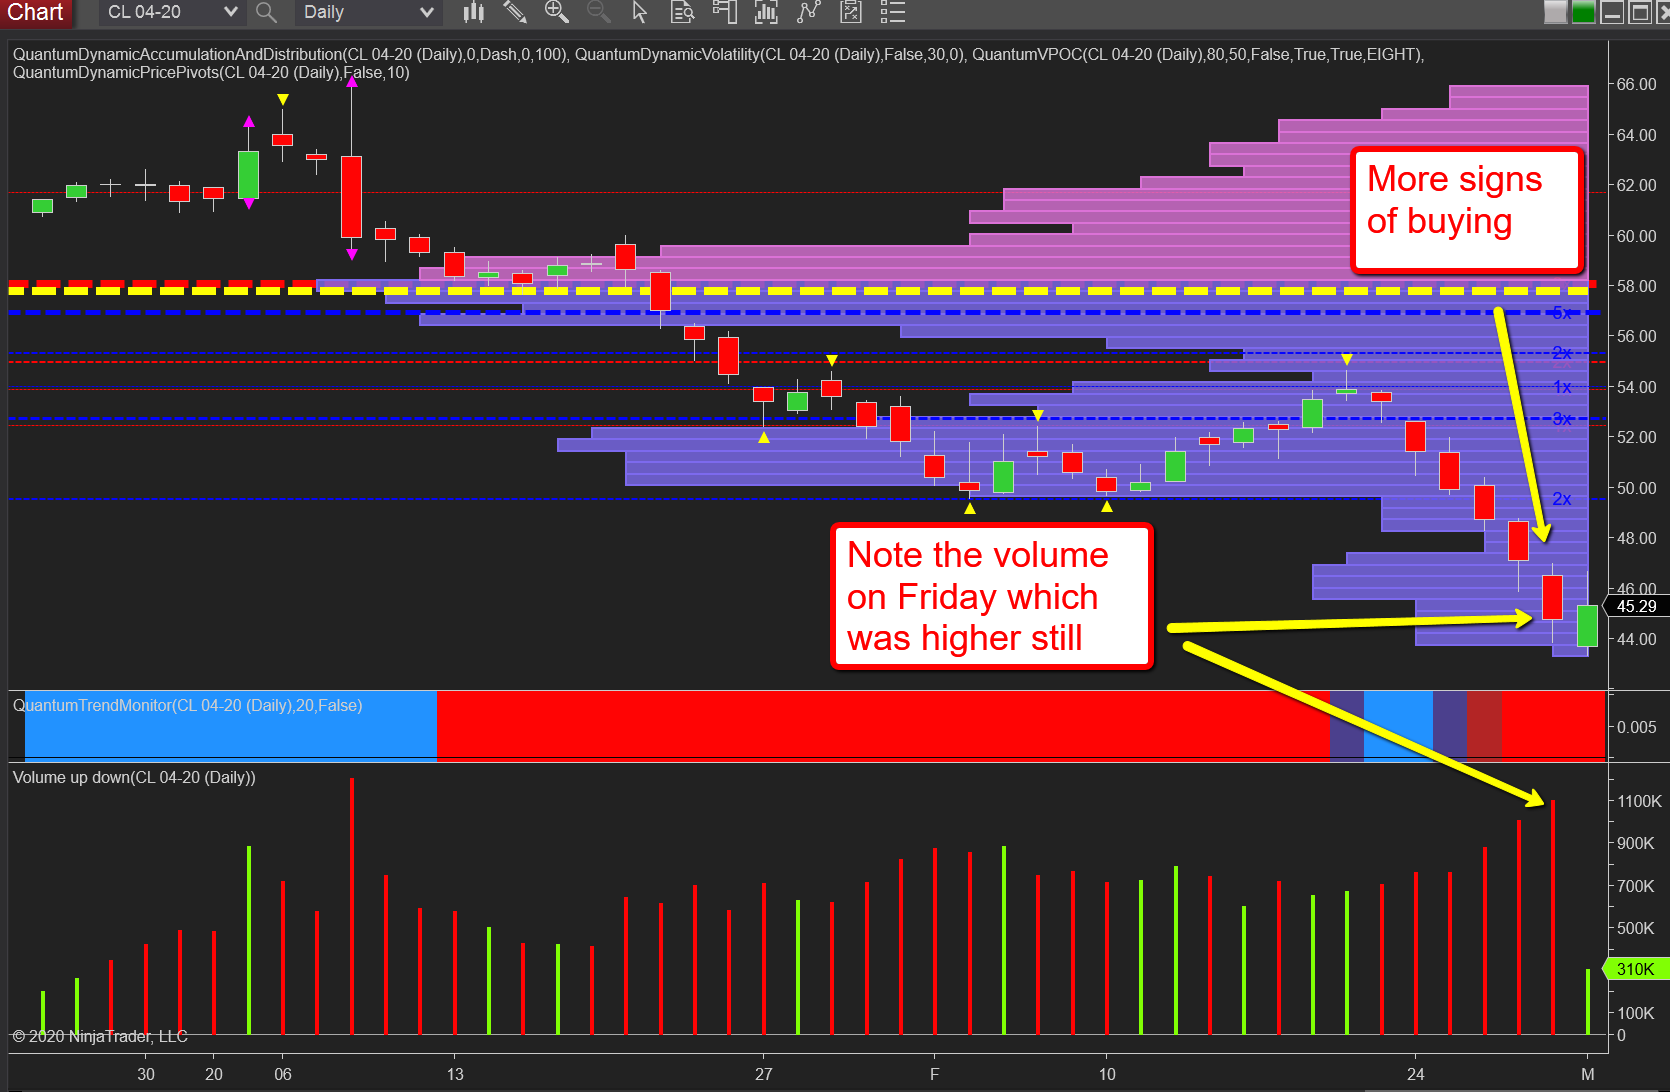
I highlighted stopping volume on the daily chart for WTI in last week’s analysis, and Friday’s price action provided further evidence of this as this market attempts to rally, along with several others.

As I pointed out last week, a move that has momentum, which is normally the case in a sustained move lower, bringing such a move to a standstill and then reversing, requires a huge amount of effort as the market has momentum.

And like a large tanker, when the engines are switched off, it will continue on for several miles thereafter before coming to a stop. It is the same here, and on Friday we saw a further bout of buying. Not how we have higher volume than on Thursday, and as such we should expect to see a much wider spread down candle.

We have not. The candle is much the same size and with a wick below, so we can conclude this is further ‘mopping up’ volume.

However, this market like several others at present continue to look fragile and weak and will take time to calm, but the first signs are developing. Over the next few days and weeks expect to see a congestion phase develop, with further mopping up of selling pressure before a longer-term reversal and rally higher develops.

Latest comments

Risk Disclosure: Trading in financial instruments and/or cryptocurrencies involves high risks including the risk of losing some, or all, of your investment amount, and may not be suitable for all investors. Prices of cryptocurrencies are extremely volatile and may be affected by external factors such as financial, regulatory or political events. Trading on margin increases the financial risks.
Before deciding to trade in financial instrument or cryptocurrencies you should be fully informed of the risks and costs associated with trading the financial markets, carefully consider your investment objectives, level of experience, and risk appetite, and seek professional advice where needed.
Fusion Media would like to remind you that the data contained in this website is not necessarily real-time nor accurate. The data and prices on the website are not necessarily provided by any market or exchange, but may be provided by market makers, and so prices may not be accurate and may differ from the actual price at any given market, meaning prices are indicative and not appropriate for trading purposes. Fusion Media and any provider of the data contained in this website will not accept liability for any loss or damage as a result of your trading, or your reliance on the information contained within this website.
It is prohibited to use, store, reproduce, display, modify, transmit or distribute the data contained in this website without the explicit prior written permission of Fusion Media and/or the data provider. All intellectual property rights are reserved by the providers and/or the exchange providing the data contained in this website.
Fusion Media may be compensated by the advertisers that appear on the website, based on your interaction with the advertisements or advertisers.
© 2007-2024 - Fusion Media Limited. All Rights Reserved.