Key Points:
- An Elliot wave could spell near-term losses for the EUR.
- A number of technical readings are now bearish.
- Medium to long-term bias remains bullish.
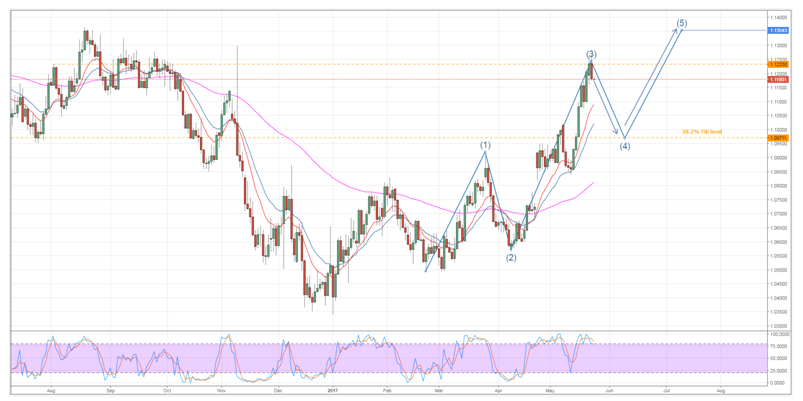
The Euro’s most recent surge higher is beginning to show signs of cracking as the bears are now putting up a bit of a fight. Indeed, last session’s slip could be the start of a rather pronounced tranche of losses that may see the pair back down at around the 1.0971 level. Although, things aren’t altogether grim as this may actually be a necessary correction in the Euro’s journey all the way back to last year’s highs.
Firstly, let’s take a look at just why a reversal and subsequent slip back to support is warranted. One vital reason to suspect a change in bias is the stochastic oscillator which is clearly overbought. However, given that this has been the case for some time, it alone is unlikely to convince the bulls to give up the ghost just yet. Fortunately, if we focus in on the last two candles it also becomes clear that we have either a tweezer top or bearish engulfing taking place which would also suggest losses are now on the way.

Incidentally, this bearish reversal is occurring at around the right price for an Elliott wave’s third leg to complete. As shown above, the recent spate of gains has stalled at the 1.1233 mark which had been a likely candidate level for a reversal given the historical resistance present at this price. Importantly, this leads us into the second part of our forecast which is concerned with how far we expect to see the EUR tumble and how high we expect the following rally to carry the pair.
Currently, it is assumed that any near-term decline could reach as low as the 1.0971 mark before the bulls regain control. Such a tumble would be appropriate for the above Elliott wave and would also respect the 38.2% Fibonacci level. As a result, it would in all likelihood require a major fundamental upset to see support at this level broken, especially as the 100 day EMA will be a source of dynamic support around this price.
Due to the relative robustness of the forecasted support level, we remain tentatively optimistic that a secondary reversal would occur around here. This should, in turn, lead into a period of gains for the EUR/USD which might extend as high as the 1.1354 mark by late July. Bullishness beyond this level is currently doubtful as we would then begin to stray into the highs of last year which may prove to be a medium to long-term limit amid the ongoing Brexit fears.
Ultimately, even if the long-term bias is incorrect, the near-term slip is looking rather likely. As mentioned, the combination of being overbought and the historic zone of resistance around the 1.1233 level should be more than a match for the already exhausted bulls. However, as always, keep an eye on the fundamental side of things as the ECB has been toying with the idea of raising rates as early as June which could prematurely end the forecasted downtrend.
