There is a pattern to be found in gold’s seemingly random walk
In the middle of last month, the price of gold was hovering around $1230 for a while. Then, on February 15, it made a bottom at $1216.60 and started rising again. The optimism went on for a couple of weeks until the precious metal reached $1264, where the bulls finally ran out of steam. As of this moment, gold is trading around $1227 and still looks vulnerable.
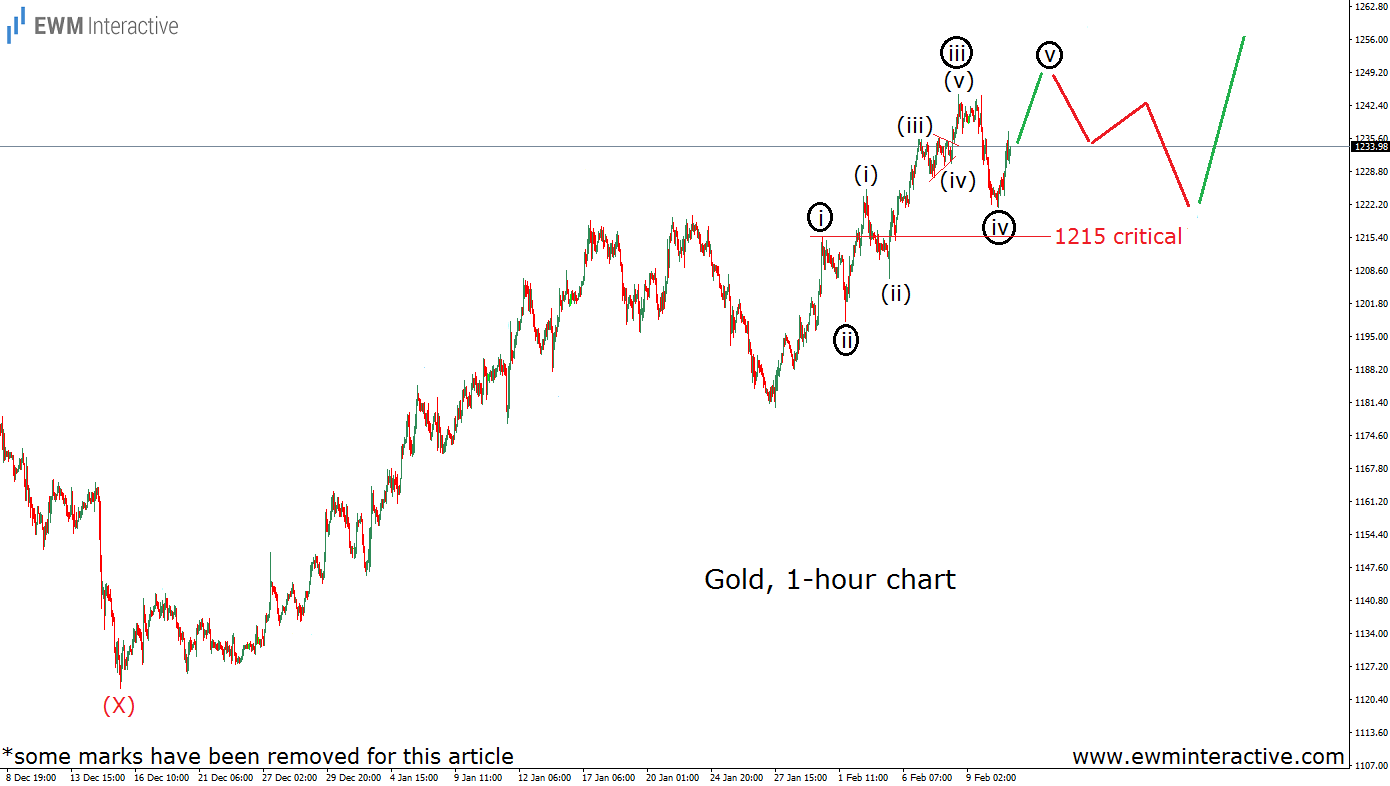
The fact that the market is constantly changing direction is nothing new. What we are interested in is a method, which could help us use its swings for our trading purposes. There are probably hundreds of different techniques traders use to sneak a peek into the future. The one we prefer is called the Elliott Wave Principle. That was the one we applied to the following chart of gold, which was then sent to clients before the market opened on February 13. (some marks have been removed for this article)
The rally between $1181 and $1245 looked like an incomplete five-wave impulse. Therefore, according to the most probable scenario, it was supposed to evolve into one by adding another advance in wave v-circled. Within every impulse, the first and the fourth wave cannot overlap. This basic Elliott Wave rule allowed us to identify $1215 – the top of wave i-circled – as a critical level to the bulls’ ambitions. As long as it was intact, gold was likely to continue towards $1250, at least. The next chart shows how things went.
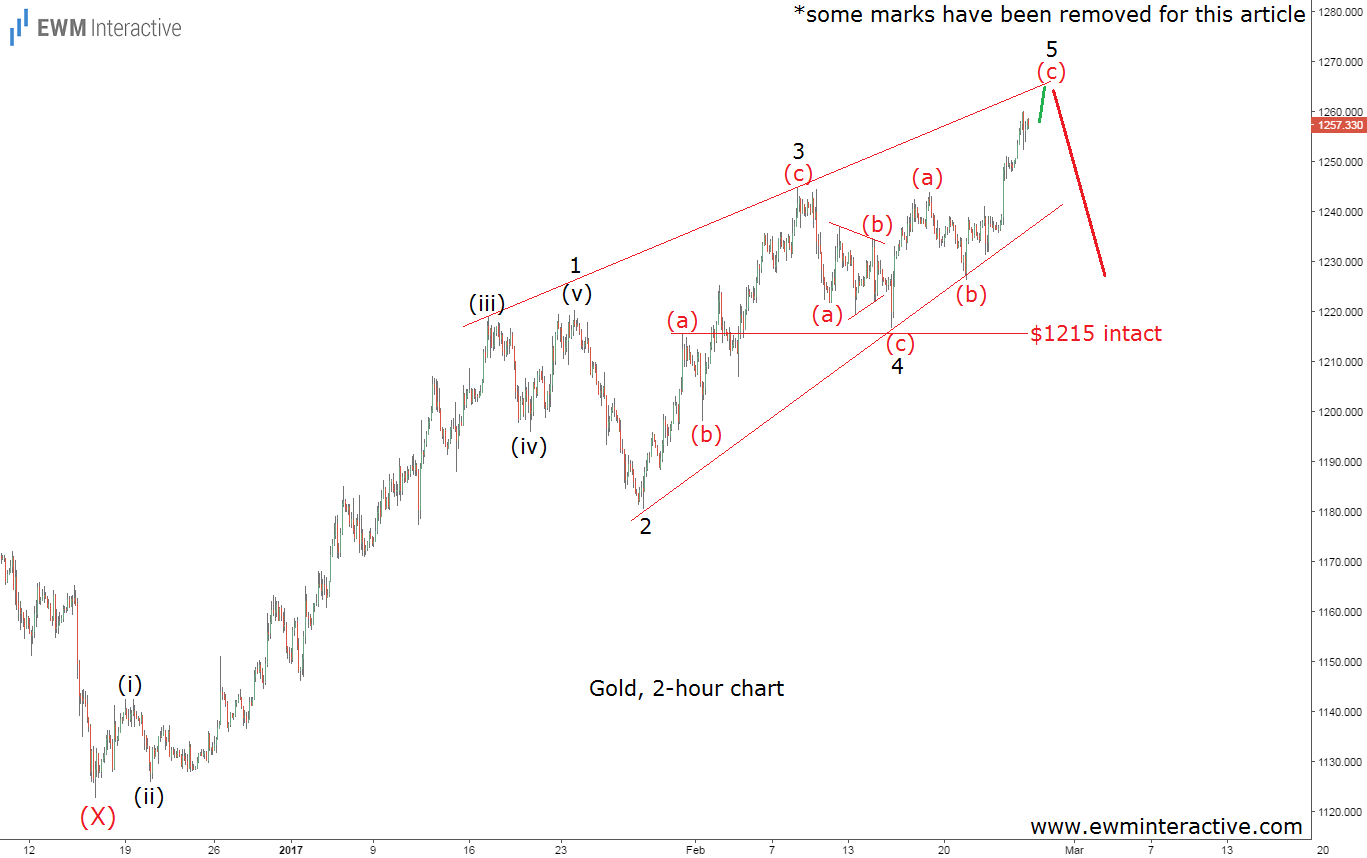
It was close, but $1215 managed to survive and that is what counts. The best the bears were able to achieve was $1216.60, which meant the positive outlook was still on the table. By the time we had to sent our February 27th update to subscribers, gold was already approaching $1260. That is when another possible scenario presented itself. As visible, we noticed that the entire uptrend from the $1123 low looks like a leading diagonal pattern. It consisted of five-waves, waves 1 and 4 were overlapping and each waves was shorter than the previous one. Diagonals carry the same message as regular impulses: expect a reversal. We did not have to wait long for it to happen.
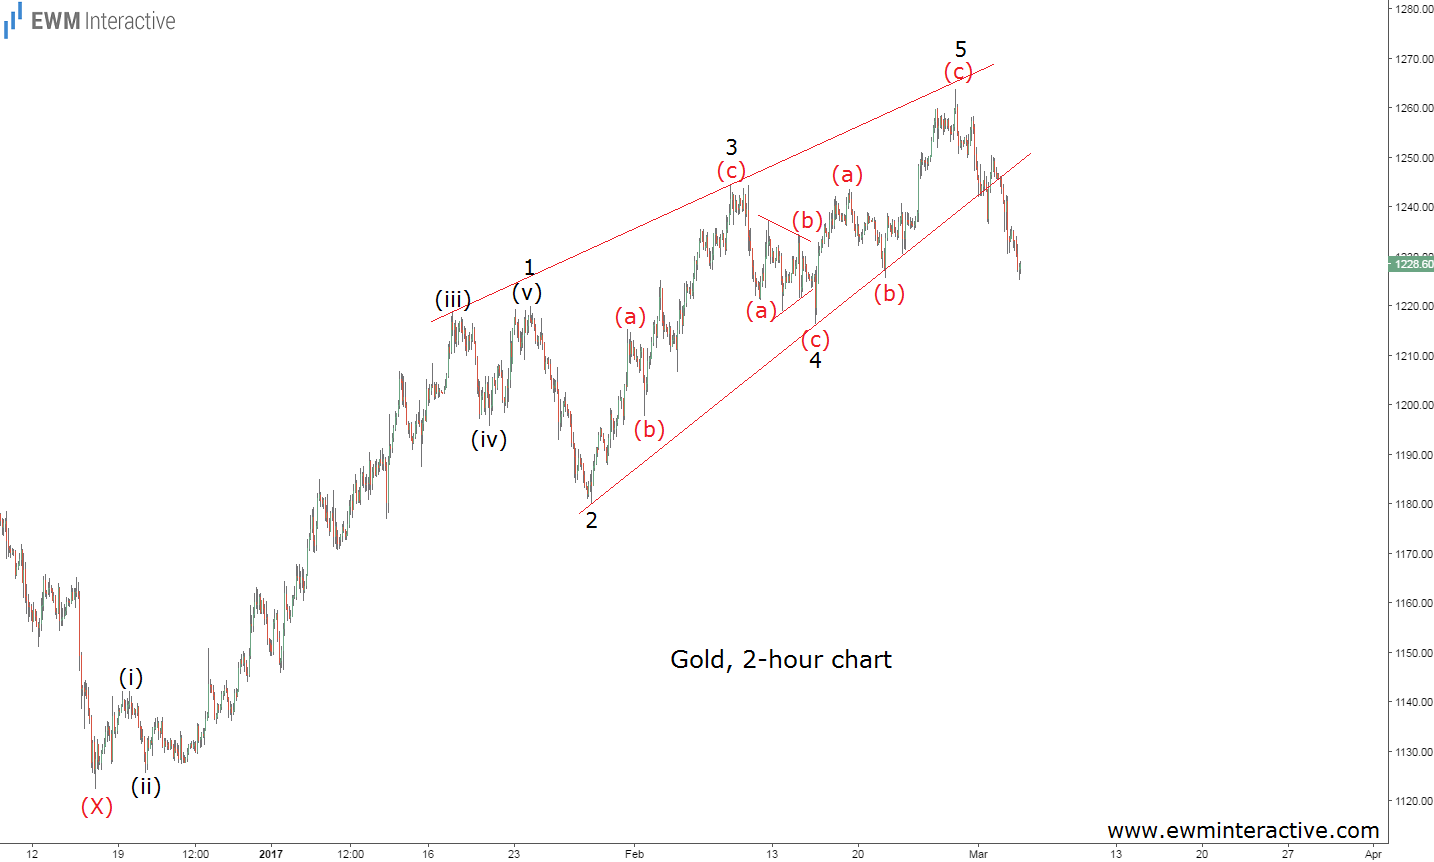
Gold prices did not even managed to touch the upper line of the diagonal. Instead, the initial optimism quickly disappeared, making way for the bears to breach the lower line and confirm the fact, that the bulls are no longer in control. Nearly $40 to the south later, gold bugs are wondering if they should switch to bitcoin, which is now officially more valuable than gold.
