
Equities and risk-linked currencies slid yesterday, while safe havens gained as disappointing U.S. data suggested that the economic wounds from the coronavirus spreading may be deeper than previously anticipated. On top of that, what may have also weighed on investors’ morale, may have been the further acceleration in both virus’s cases and deaths for Wednesday.
RISK AVERSION DEEPENS, INITIAL JOBLESS CLAIMS BACK IN FOCUS
The dollar traded higher against all the other G10 currencies on Wednesday and during the Asian morning Thursday. It gained the most versus NOK, AUD, NZD, and CAD in that order, while it eked out the least gains against JPY and CHF.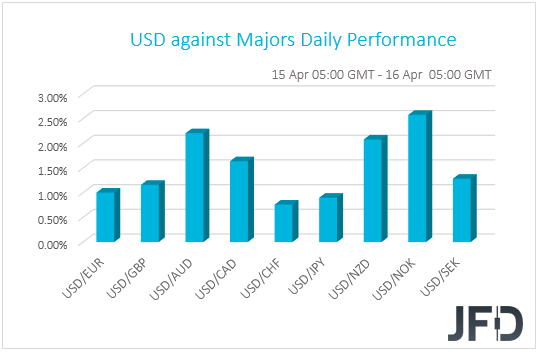
The weakening of the risk-linked and oil-related currencies, combined with the relative strength of the safe havens suggests that market participants traded in a risk-off fashion yesterday. Indeed, turning our gaze to the equity sphere, we see that major EU and U.S. indices were a sea of red, with the downbeat appetite rolling into the Asian session today.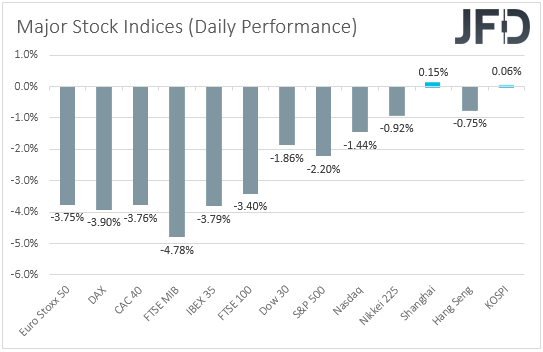
Following the acceleration in both infected cases and deaths from the coronavirus for Tuesday, investors received another reality check by the more-than-expected tumble in the U.S. retail sales for March, which suggested that the damages on the US economy during the month may have been larger than previously anticipated. Most importantly, at least in our view, the New York Empire State manufacturing index for April tumbled to a record low of -78.20 from -21.50, suggesting that the wounds of the manufacturing sector dragged into the second quarter of the year, despite some signs that the virus was slowing down. This raises questions as to whether the Markit and ISM manufacturing PMIs for the U.S. as a whole will disappoint as well.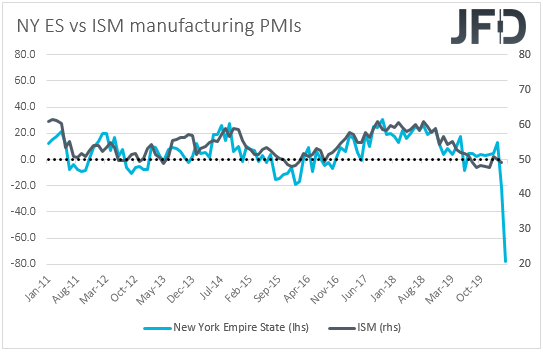
Paradoxically, it appears that disappointing U.S. data work against equities, but in favor of the U.S. dollar. This may have been the case due to the fact that, in a dollar-denominated world, during periods of high turbulence and uncertainty, market participants likely prefer to liquidate their assets and hold cash. In other words, the U.S. dollar appears to be wearing its safe-haven suit recently.
On top of the disappointing U.S. data, what may have also weighed on investors’ morale, may have been the further acceleration in cases and deaths for Wednesday, with deaths hitting a new daily record. Remember that we have been repeatedly noting that just a day of new records may be enough to revive fears and trigger another round of risk aversion. Now it remains to be seen whether the latest acceleration is the exception of a broader slowdown, or whether the latest slowdown was just a pause in the exponential spreading.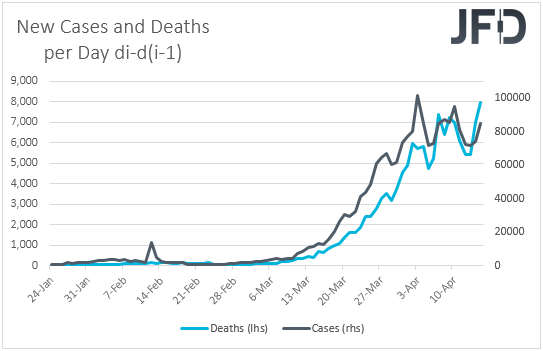
Yesterday’s statistics and market reaction confirm our view to stay reluctant in trusting a long-lasting recovery in the broader sentiment, and instead, take things day by day. We will continue in that mode and we believe that another round of accelerating virus cases may bring equities and risk-linked assets lower, while safe-havens may shine. The opposite may be true if we get a slowdown.
Having said all that, today, investors may lock their gaze for another week to the U.S. initial jobless claims for the week ended on April 10th. After hitting a record of 6.87mn three weeks ago, we got another surge the following week, with the report revealing 6.61mn new claims. Now the forecast points to 5.11mn, but bearing in mind that both prior reports have exceeded estimates, we wouldn’t be surprised if we get another number above the 6mn mark. Something like that may signal that the damages in the labor market are more severe than previously anticipated and could bring equities and the risk-linked currencies under selling pressure. The safe havens dollar, yen and franc may be the main beneficiaries among the G10 currencies.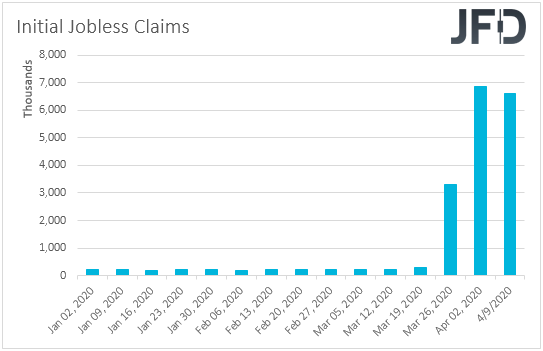
The Loonie and the Norwegian Krone may have felt the heat of the slide in oil prices. Both WTI and Brent slid 1.20% and 6.45% respectively after the EIA (Energy Information Administration) reported its biggest weekly inventory build on record, something that may have increased concerns that the weekend output-cut agreement between the OPEC+ members may not be enough to offset the tumble in demand due to the fast-spreading pandemic.
We also had a BoC policy decision yesterday, but with all the attention on the U.S. data and the virus sage, it may have gained less attention that it could have otherwise. The Bank decided to keep interest rates unchanged at 0.25%, repeating that this is the effective lower bound, but decided to expand its QE purchases. Officials noted that they will temporarily increase purchases of Treasury Bills to up to 40%, while they announced two new programs. A Provincial Bond Purchase Program of up to CAD 50bn and a Corporate Bond one of up to CAD 10bn.
Today, during the Asian morning, we goth Australia’s employment report for March, which came in better than expected, but the Aussie barely reacted, staying a victim of the broader risk-off environment.
NZD/JPY – TECHNICAL OUTLOOK
Yesterday, NZD/JPY broke below its short-term tentative upside support line drawn from the low of March 23rd. The pair is currently getting a hold-up near the 64.10 hurdle, which may force the rate to rebound slightly. That said, if NZD/JPY struggles to move back above that upside line, or above its EMAs on the 4-hour chart, the near-term outlook could stay somewhat bearish for a while.
As mentioned above, the 64.10 zone, which marks the high of April 2nd and is the current low of this week, could force the rate to rebound slightly. That move may test the aforementioned upside line from underneath. If the pair stays either below the upside line, or below all of the EMAs on the 4-hour chart, this may lead to another slide, which could violate the 64.10 obstacle. If so, such a move might clear the path to the 63.07 level, marked by the current lowest point of April.
Alternatively, if the rate climbs back above the previously-discussed upside line and travels above the 65.47 barrier, marked near the low of April 13th and near the high of April 15th, this may attract a few extra bulls into the field. NZD/JPY could then drift to the 66.15 obstacle, a break of which might lift the pair to the 66.62 level, which is the high of March 11th.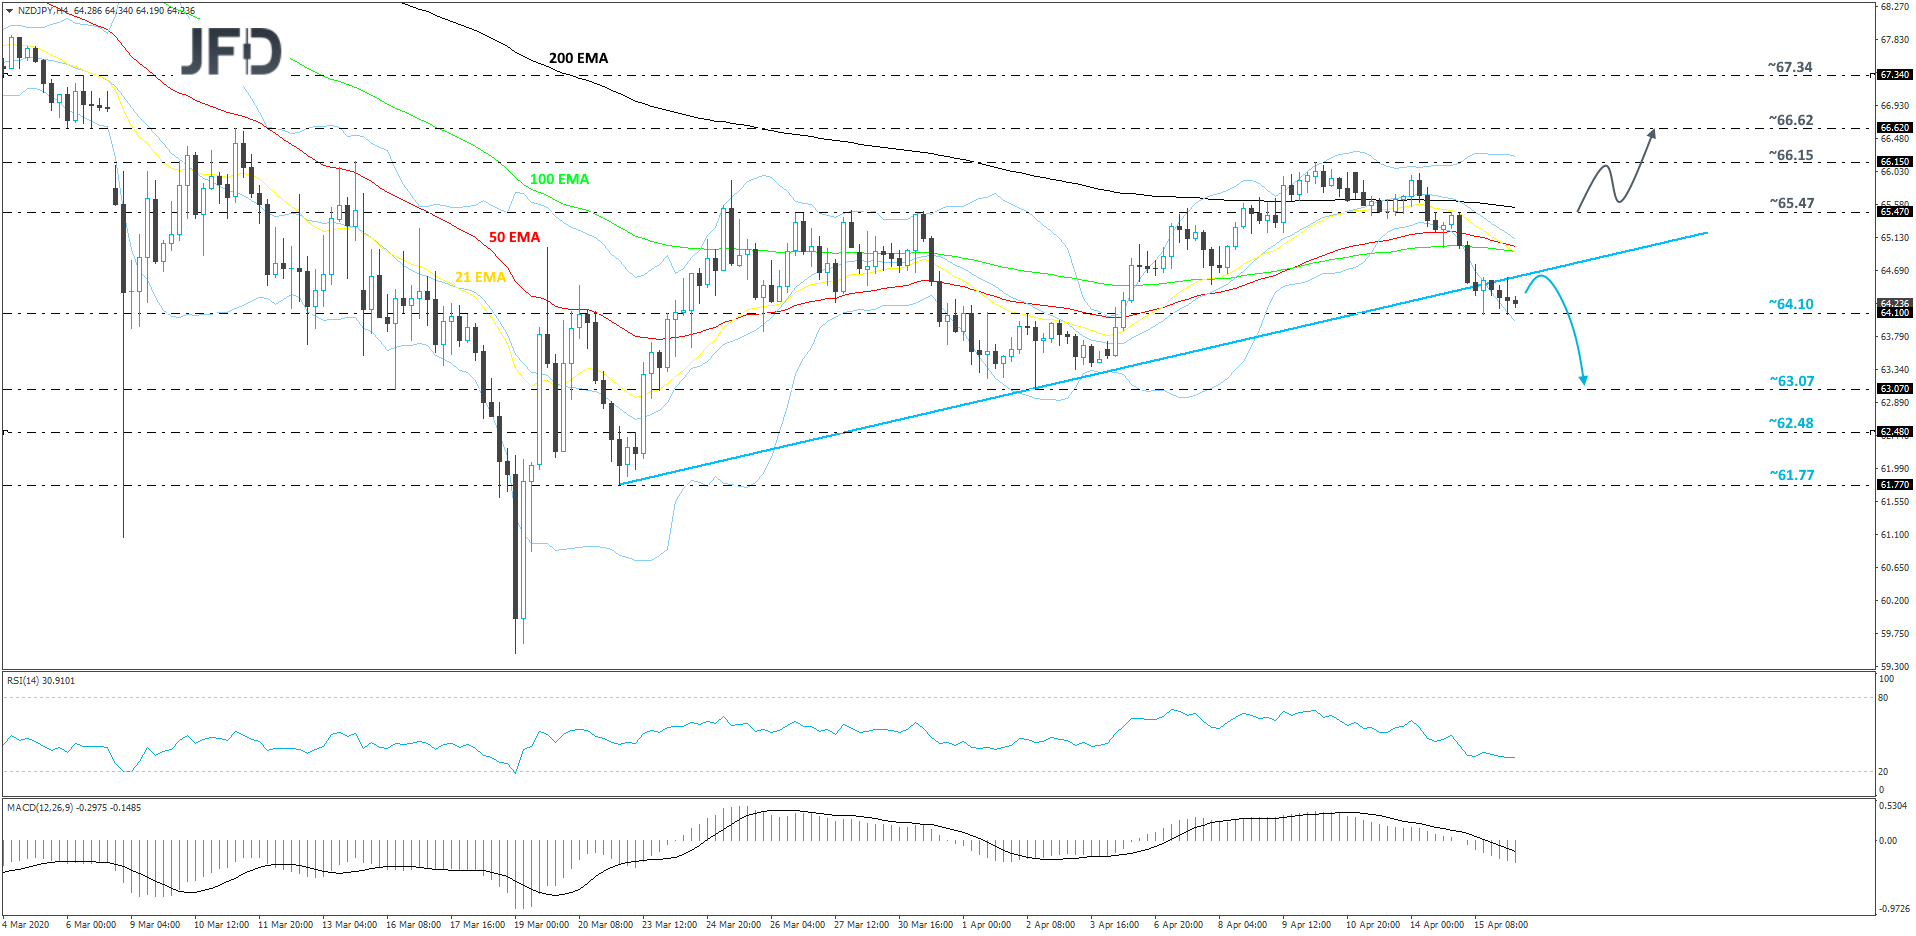
AUD/USD – TECHNICAL OUTLOOK
This morning, AUD/USD dropped below its short-term tentative upside support line taken from the low of March 19th. Although such a move might be considered as a bearish one, still, the pair would need to overcome a few more hurdles before we could get slightly more comfortable with further declines. In order to examine a deeper extension to the downside a drop below the 0.6213 area would be needed. Until then, we will remain neutral.
If, eventually, we do see a slide below the 0.6213 territories, which is the high of March 31st and near the low of April 9th, this may invite a few more bears into the field. Such a move may bring AUD/USD closer to the 0.6115 zone, which is the low of April 8th. If the selling-interest is still strong, a further decline could push the pair to the 0.5980 level, marked by the current lowest point of April.
On the other hand, if the rate gets lifted back above the aforementioned upside line and the 0.6374 barrier, marked near the high of April 10th and near the low of April 14th, this may spook the bears temporarily. AUD/USD could then travel to the current highest point of April, at 0.6444, a break of which may send the rate to the 0.6539 level, marked by the high of March 11th.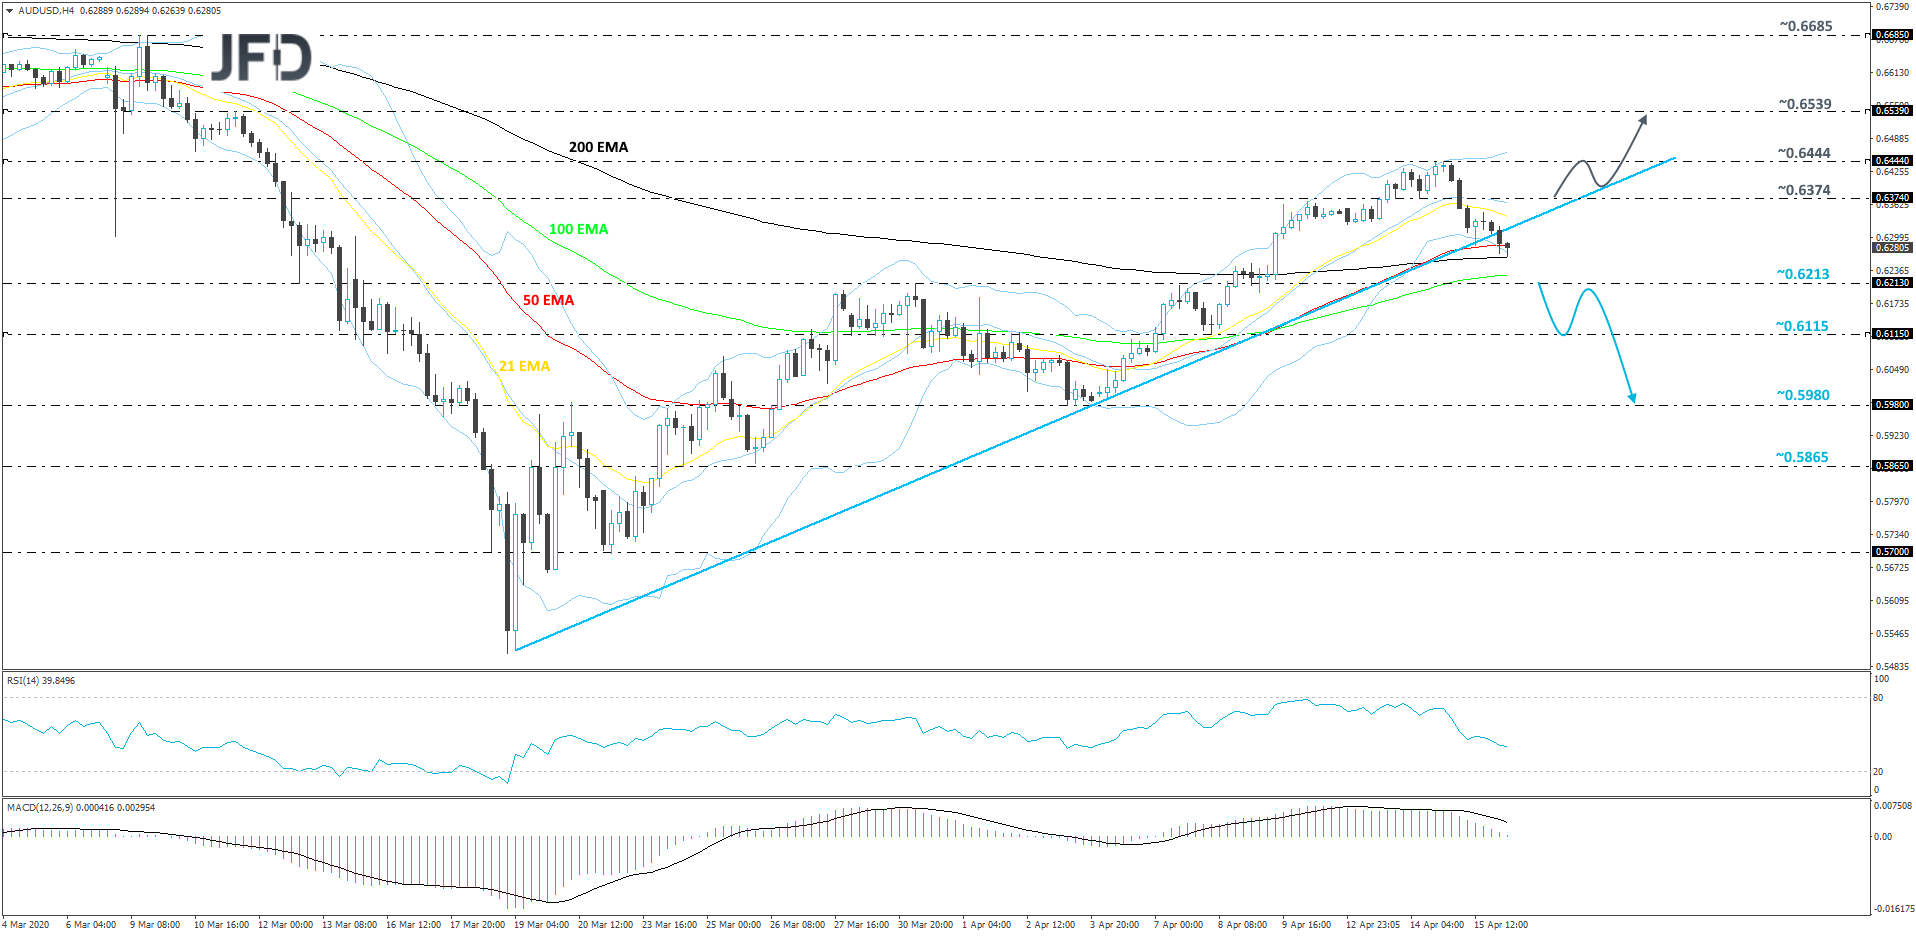
AS FOR THE REST OF TODAY’S EVENTS
During the European morning, we get Germany’s final inflation data for March, but as it is always the case, they are expected to confirm their preliminary estimates. Eurozone’s industrial production for February is also due to be released and the forecast points to a 0.2% mom slide after a 2.3% increase in January.
From the US, apart from the initial jobless claims, we have building permits and housing starts for March, as well as the Philly Fed manufacturing index for April. Both building permits and housing starts are expected to have declined somewhat, while the Philly Fed index is forecast to have slid to -30.0 from -12.7. Similarly, with the New York Empire State index, a larger decline could be an early sign that the damages in the manufacturing sector would drag more than previously estimated.
As for tonight, during the Asian session Friday, we get China’s GDP for Q1, as well as retail sales, industrial production and fixed asset investment, all for March. The nation’s economy is all but certain to have shrank in the first three months of the year, due to the coronavirus outbreak, with the market consensus pointing to a 6.0% contraction. Retail sales, industrial production and fixed asset investment are all expected to have continued sliding in March, but at a slower pace than in February. Bearing in mind that the spreading of the virus in China slowed notably during the third month of this year, we wouldn’t be surprised if we get better readings. The big question is whether the economy has started recovering in the second quarter, after the nation has lifted several restrictive measures.
- English (UK)
- English (India)
- English (Canada)
- English (Australia)
- English (South Africa)
- English (Philippines)
- English (Nigeria)
- Deutsch
- Español (España)
- Español (México)
- Français
- Italiano
- Nederlands
- Português (Portugal)
- Polski
- Português (Brasil)
- Русский
- Türkçe
- العربية
- Ελληνικά
- Svenska
- Suomi
- עברית
- 日本語
- 한국어
- 简体中文
- 繁體中文
- Bahasa Indonesia
- Bahasa Melayu
- ไทย
- Tiếng Việt
- हिंदी
The Dollar Paradox: Rebounds On Bad U.S. Data
Published 04/16/2020, 03:52 AM
Updated 07/09/2023, 06:31 AM
The Dollar Paradox: Rebounds On Bad U.S. Data
Latest comments
Loading next article…
Install Our App
Risk Disclosure: Trading in financial instruments and/or cryptocurrencies involves high risks including the risk of losing some, or all, of your investment amount, and may not be suitable for all investors. Prices of cryptocurrencies are extremely volatile and may be affected by external factors such as financial, regulatory or political events. Trading on margin increases the financial risks.
Before deciding to trade in financial instrument or cryptocurrencies you should be fully informed of the risks and costs associated with trading the financial markets, carefully consider your investment objectives, level of experience, and risk appetite, and seek professional advice where needed.
Fusion Media would like to remind you that the data contained in this website is not necessarily real-time nor accurate. The data and prices on the website are not necessarily provided by any market or exchange, but may be provided by market makers, and so prices may not be accurate and may differ from the actual price at any given market, meaning prices are indicative and not appropriate for trading purposes. Fusion Media and any provider of the data contained in this website will not accept liability for any loss or damage as a result of your trading, or your reliance on the information contained within this website.
It is prohibited to use, store, reproduce, display, modify, transmit or distribute the data contained in this website without the explicit prior written permission of Fusion Media and/or the data provider. All intellectual property rights are reserved by the providers and/or the exchange providing the data contained in this website.
Fusion Media may be compensated by the advertisers that appear on the website, based on your interaction with the advertisements or advertisers.
© 2007-2024 - Fusion Media Limited. All Rights Reserved.