How much are you willing to pay to get what you want?
This question is especially important right now because there are so many good companies that currently have expensive valuations.
Procter & Gamble Company (NYSE:PG) is a perfect example. As I explained earlier this week, the company’s total valuation has become stretched, and the stock’s recent underperformance is glaring.
But it’s not the only Dividend Aristocrat that’s lagging…
As the S&P 500 continues to reach all-time highs, many Dividend Aristocrats aren’t even close to breaking out.
Is this an early warning sign that the Aristocrats are set for an ugly fall from grace?
Let’s take a look at the valuations of the Dividend Aristocrats, in an attempt to determine what’s plaguing this group of prolific dividend growers.
As we know, the SPDR S&P Dividend ETF (NYSE:SDY), which tracks the S&P High Yield Dividend Aristocrats Index, is one of the most popular dividend ETFs.
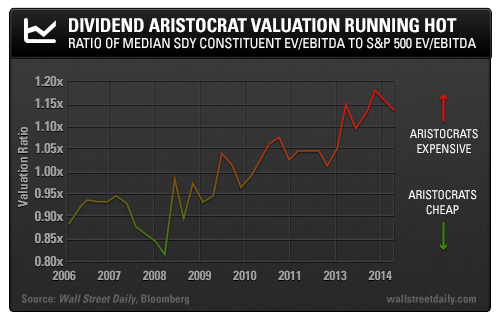
The chart below compares the valuations of the constituents of SDY (excluding financials) with the broader market’s valuation.

A value of 1.0x means that the median enterprise value-to-EBITDA multiple of SDY is equal to that of the S&P 500’s EV/EBITDA multiple. Anything below 1.0x means that the Aristocrats (as a group) are trading at a discount to the market.
The chart shows that in mid-2008, the Dividend Aristocrats were downright cheap on a relative basis. The performance results agree with this observation…
Since June 2008, the SDY has produced a total return (dividends reinvested) of 113%, far outpacing the S&P 500’s gain of 77%.
Buying cheap stocks paid off handsomely.
But in mid-2013, the valuation of the Aristocrats became fairly expensive relative to that of the broader market. Accordingly, since June 2013, SDY has achieved a total return of 19%, trailing the S&P 500’s gain of 26%.
In other words, the EV/EBITDA ratio helps to explain the Aristocrats’ long-term outperformance, as well as their short-term underperformance.
Knowing Everything’s Price, and Nothing’s Value
Again, one of the reasons why EV/EBITDA works so well is because few investors look at this valuation metric.
Even when presented with statistical evidence suggesting that EV/EBITDA is the best-performing valuation metric, most investors will stick with the simple P/E ratio.
So while others remain blissfully unaware of valuations, we need to be vigilant. We should be emphatic about dividend growth, but we shouldn’t be willing to pay an arm and a leg to have it in our portfolios.
Even stocks with long histories of dividend growth can have prices that make them unattractive. The chart above suggests that now is one of those times for the Dividend Aristocrats.
Intuitively, this makes sense to me. As the Federal Reserve’s zero interest rate policy has dragged on, consistent dividend growers have become increasingly popular. More and more people have jumped on the bandwagon, driving up prices and making the Aristocrats more expensive than the broader market.
Armed with this information, your plan of action now depends on what type of investor you are. If you like to follow a simple buy-and-hold strategy, then SDY will probably be fine for you over the long term.
On the other hand, if you want to outperform and retire early (or sleep more soundly in retirement), then you should only seek out the cheapest Aristocrats.
It’s important to be selective, because the Dividend Aristocrats have gotten too rich… That’s not a statement you’ll likely hear anywhere else.
Safe (and high-yield) investing,
BY Alan Gula, CFA
