Is the WTI oil rally ready to bust, or is this the beginning of a boom?
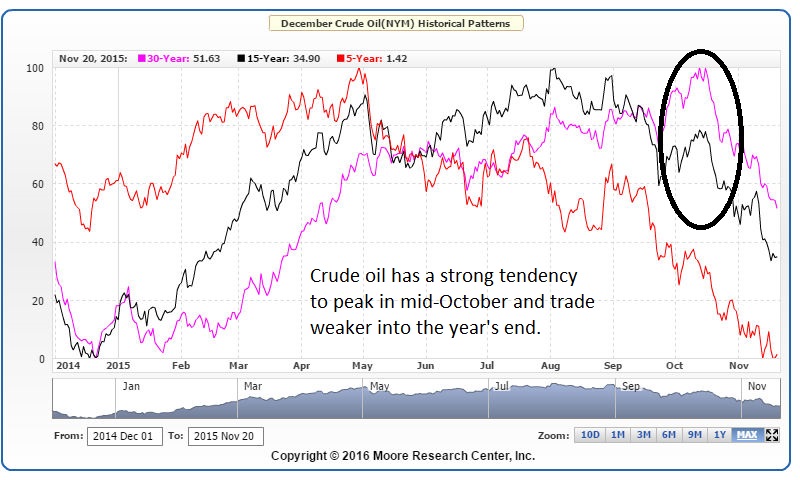
OPEC’s pledge to trim output quickly changed the short-term landscape of the crude oil market but it probably didn’t solve the long-term supply problem and it certainly didn’t alter the seasonal tendency of the commodity. According to the last thirty years of data, Moore Research Center, Inc. (MRCI) has found that the price of oil (based on the December futures contract) tends to peak in mid-October.
More specifically, the seasonal service claims a trader selling December crude oil on October 16th and buying it back on the 30th would have been profitable in 13 of the previous 15 years. While we understand each trading year is unique in its fundamental, political, and economic environment we also recognize that reoccurring patterns generally shouldn’t be scoffed at.

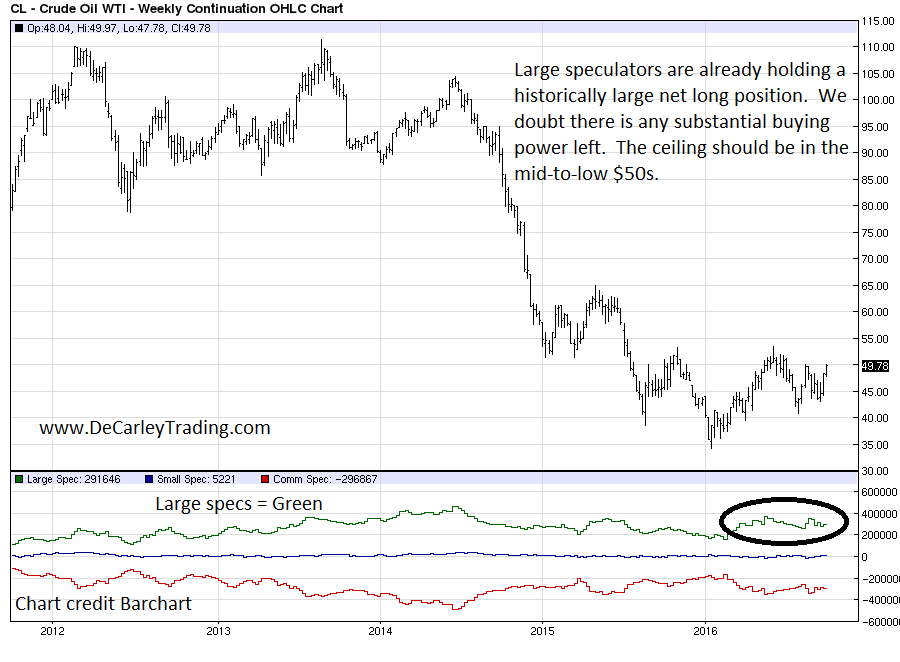
Supporting our idea of the potential for some sort of October topping action in the oil market, we have noticed that large speculators are holding a historically net long position. Not only does this increase the chance of sharp liquidation should a news event or change in climate rock the boat, but it suggests that there likely isn’t a lot of additional buying power in the pockets of those traders capable of pushing prices much higher than they currently are.
To put things into perspective, large speculators in crude oil are holding about 300,000 net long futures contracts. This market has been reluctant to trade higher once this figure gets into the 350,000 to 360,000 area. The crude oil could continue to grind higher for another dollar or two in the price of a barrel but the upside is expected to be relatively limited.

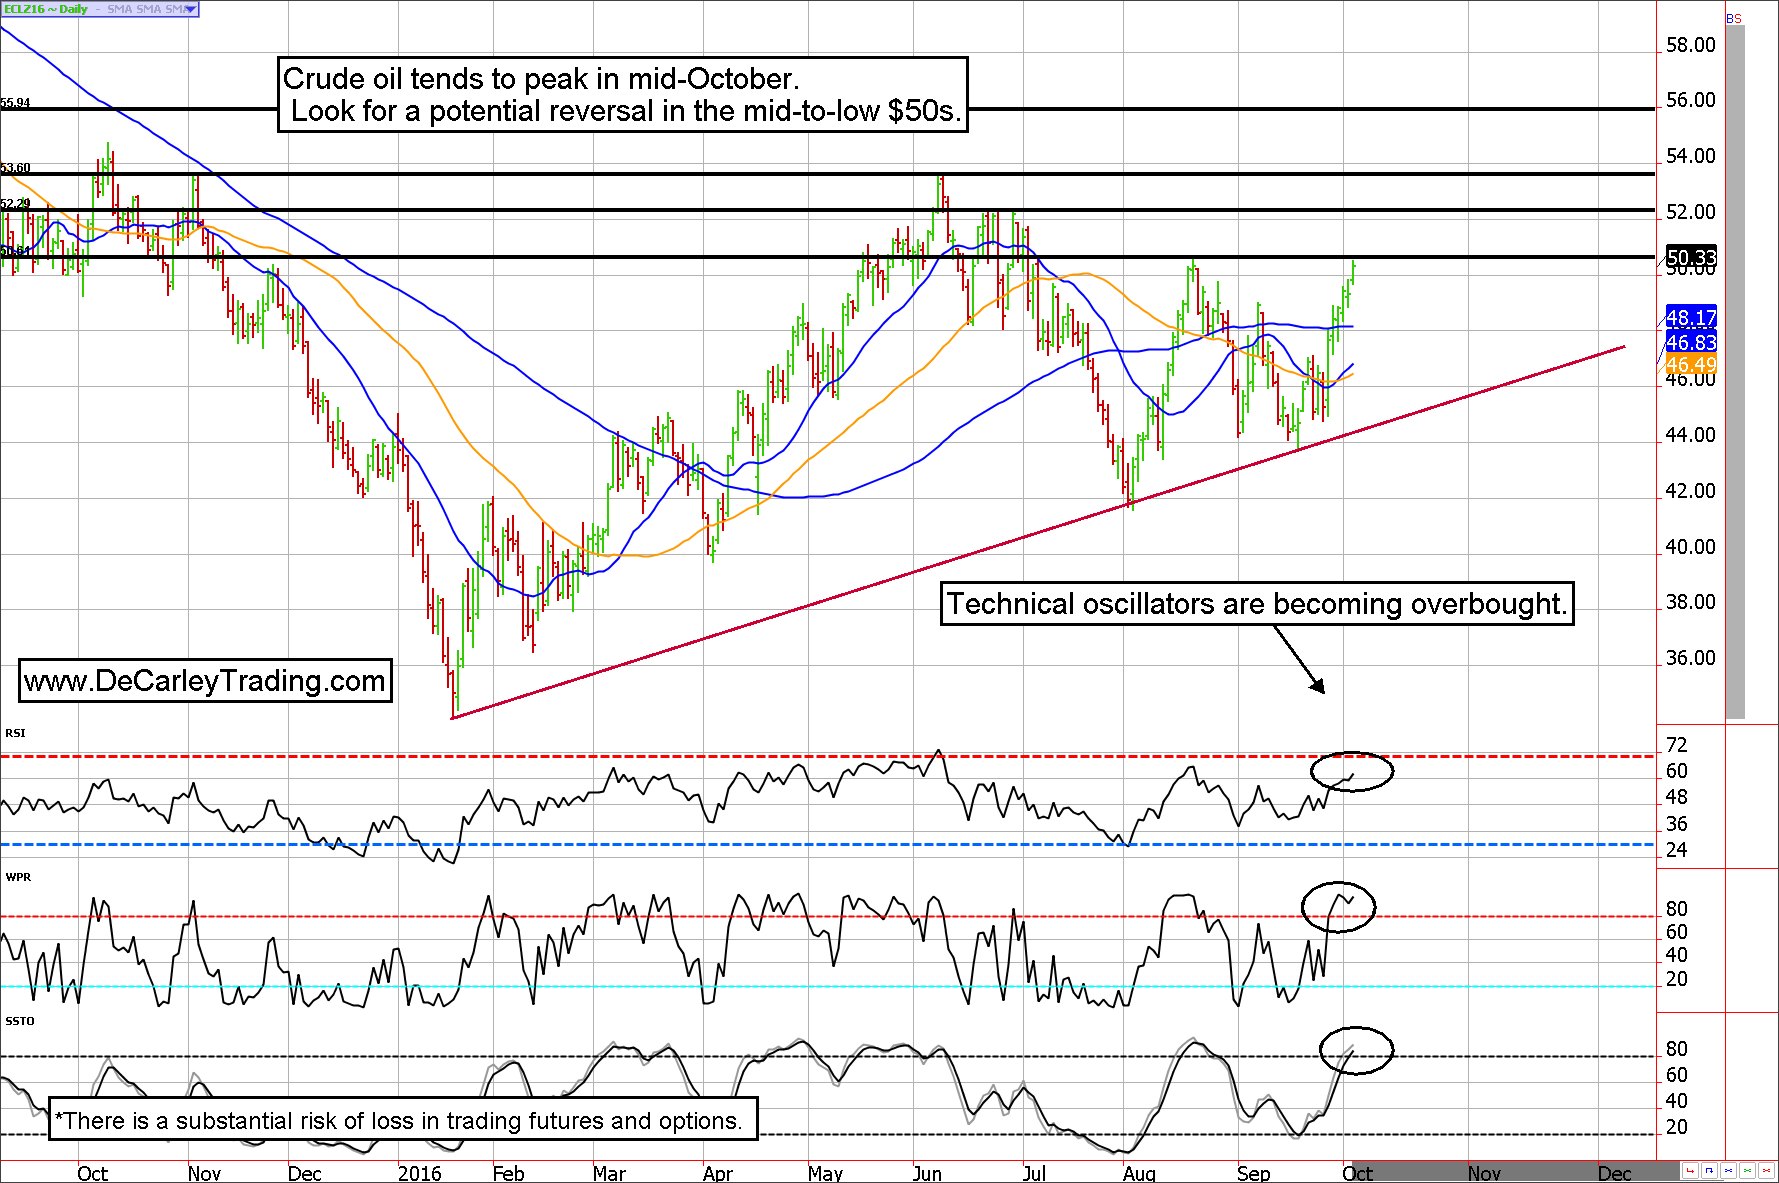
Assuming our prediction of a limited upside is accurate, we used a chart to determine the most likely reversal points. Of course, we aren’t fortune tellers. Regardless of the analysis used and how much time we allocate to studying charts and other aspects of the oil market we will never be able to predict the high or low of a move with complete accuracy. Our hope is that if we get in the vicinity of the turning point, it might be useful to traders.
We see four potential reversal areas in crude oil using the December futures contract. The first is $51.00 per barrel; not only is this a psychological barrier for prices it is also near the August high. However, judging by the technical oscillators which are moving into overbought territory but aren’t completely saturated just yet, we could have a little farther to travel on the upside.
Additionally, traders tend to put buy stop orders above significant highs, and markets tend to run those stops before rolling over. Accordingly, we suspect the price of crude oil will move toward the next technical resistance level of $52.20 and possibly continue to the 53.60 area. The most likely turning point in oil will be between these two prices ($52.20 and $53.60) in the December futures contract.
However, we cannot rule out an out-of-control spike to the $56 area. This is not expected, and if seen would be a high probability trade for bearish traders. Nevertheless, it is a move that should be prepared for in a bearish crude oil strategy. On the flip side, those with bullish strategies should be taking profits on the way up but might want to leave a “flyer” in hopes of seeing the $56.00 area.
Carley Garner
DeCarley Trading (a division of Zaner)
Twitter:@carleygarner
info@decarleytrading.com
1-866-790-TRADE(8723)
www.DeCarleyTrading.com
www.HigherProbabilityCommodityTradingBook.com
**There is substantial risk of loss in trading futures and options.
** These recommendations are a solicitation for entering into derivatives transactions. All known news and events have already been factored into the price of the underlying derivatives discussed. From time to time persons affiliated with Zaner, or its associated companies, may have positions in recommended and other derivatives. Past performance is not indicative of future results. The information and data in this report were obtained from sources considered reliable. Their accuracy or completeness is not guaranteed. Any decision to purchase or sell as a result of the opinions expressed in this report will be the full responsibility of the person authorizing such transaction. Seasonal tendencies are a composite of some of the more consistent commodity futures seasonals that have occurred over the past 15 or more years. There are usually underlying, fundamental circumstances that occur annually that tend to cause the futures markets to react in asimilardirectional manner during a certain calendar year. While seasonal trends may potentially impact supply and demand in certain commodities, seasonal aspects of supply and demand have been factored into futures & options market pricing. Even if a seasonal tendency occurs in the future, it may not result in a profitable transaction as fees and the timing of the entry and liquidation may impact on the results. No representation is being made that any account has in the past, or will in the future, achieve profits using these recommendations. No representation is being made that price patterns will recur in the future.
