The week of July 22 will be a busy one, between earnings and economic data. A big second-quarter GDP print will conclude it on Friday morning. Currently, the consensus is for 1.9%.
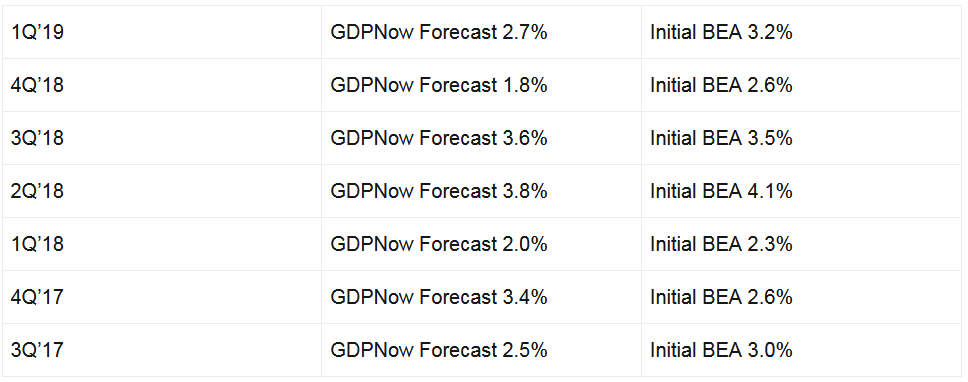
GDPNow is forecasting growth of 1.6% in the second quarter, but their forecast has been running light the last few quarters, and there is still one more estimate that needs to be plugged into the model later this week. I put together this table so you can see what I mean.
The GDPNow forecast has only overestimated the final GDP reading on two occasions over the past 7 GDP prints. Meanwhile, it was under the actual results five times, with an average difference of about 0.5%, which is a pretty wide margin. So while it is unlikely that we will see a 3% print this quarter, it seems possible that we see something around 2.1 to 2.4%.
The GDP reading will also come about a week before the next Fed meeting so that it will carry a great deal of weight on the Fed’s decision.
The FOMC rate watch tool is all over the place, with the odds swinging for a 50 basis point rate cut from low to high literally overnight. As of Friday night, the probability of a 25 basis point cut is now back to 78%, and a 50 basis point is now down to 22%.
If anything, it proves just how unsure the market is, and that it has little idea about what to expect.
The most likely scenario based on what I have seen in the past: a cut by 25 basis points this month and signal a strong chance for another cut in September. But remember in August is the KC Fed Jackson Hole summit, and that will allow Powell to tell the market another rate cut in September is all but inevitable.
Earnings Estimates
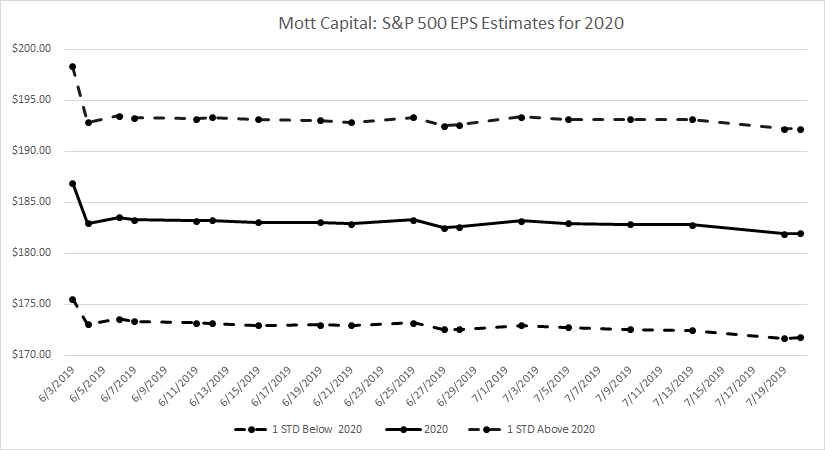
Moving on, I am now modeling 2020 earnings estimates of $181.99, with a one standard deviation range of $171.77 to $192.20. This will be the first time I am revealing the chart below to you because I finally have more than a month’s worth of data. The estimates have a hard to see lower drift to them, but it is there.
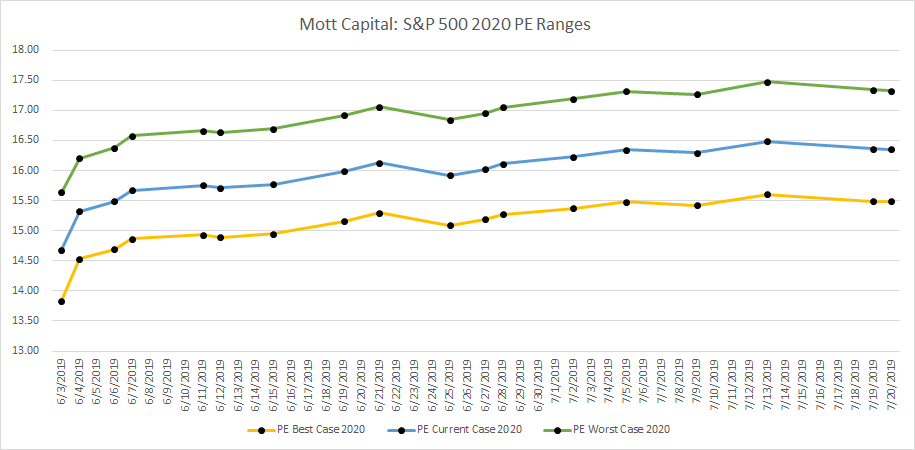
In the next chart, I map out the changes in the PE ratio for the S&P 500 using my estimates, accounting for the one standard deviation range in the forecast. We can see that the S&P 500 is currently trading are 17.5 times the worst-case scenario earnings estimates of $171.77 per share, about 5.6% below the current actual forecast of $181.99. It makes the S&P 500 fully valued based on the worst-case scenario estimates. However, it is still undervalued based on the base case scenario, trading at roughly 16 times 2020 estimates.
Stocks Vs. Bonds
Stocks are still relatively undervalued compared to bonds, although in recent days the spread between the 10-Year Yield and S&P 500 SPDR (NYSE:SPY) dividend yield has widened to roughly 21 basis points. It had fallen as low as 15 basis points at the start of July. It does show that the spread is the narrowest it has been in some time.
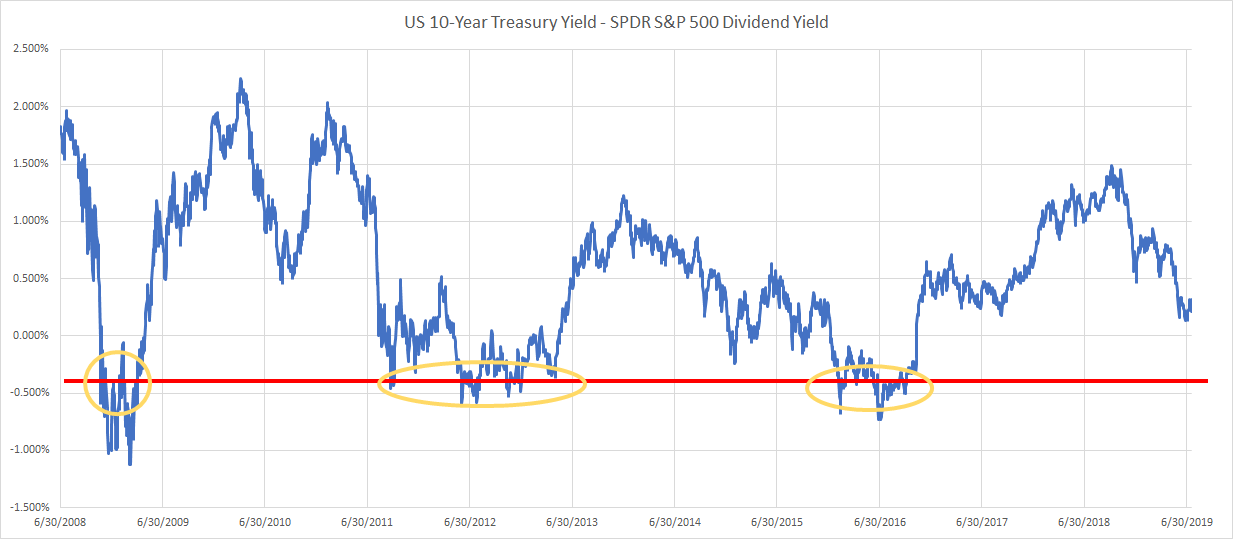
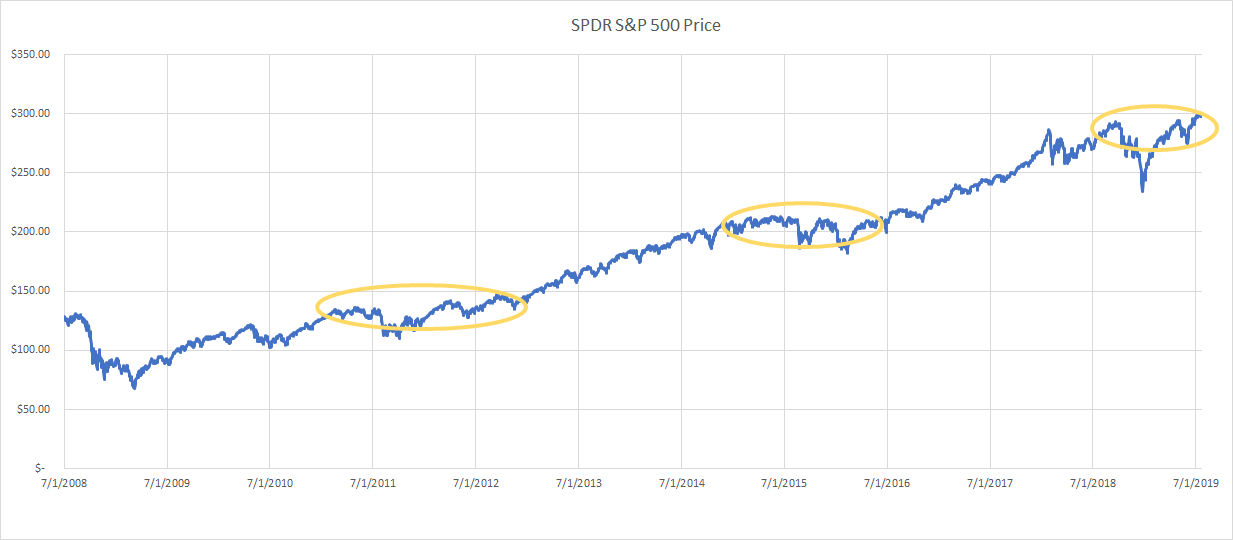
While the spread isn’t inverted currently, it is at a low enough point, that historically, it suggests that equity prices should do fairly well, as noted in the chart below.
Conclusion
So while over the short-term, the market may or may not experience some volatility due to changes in Fed interest rate expectations. The current set up in stocks still appears to be reasonably bullish. With a 25 basis point cut coming in July, and another likely in September.
Based on my current expectations for earnings in 2020, I still think the S&P 500 could rise to around 3,200. Meanwhile, should interest rates remain at these present or lower, I can see some further multiple expansion pushing the index perhaps to as high as 3,300.
