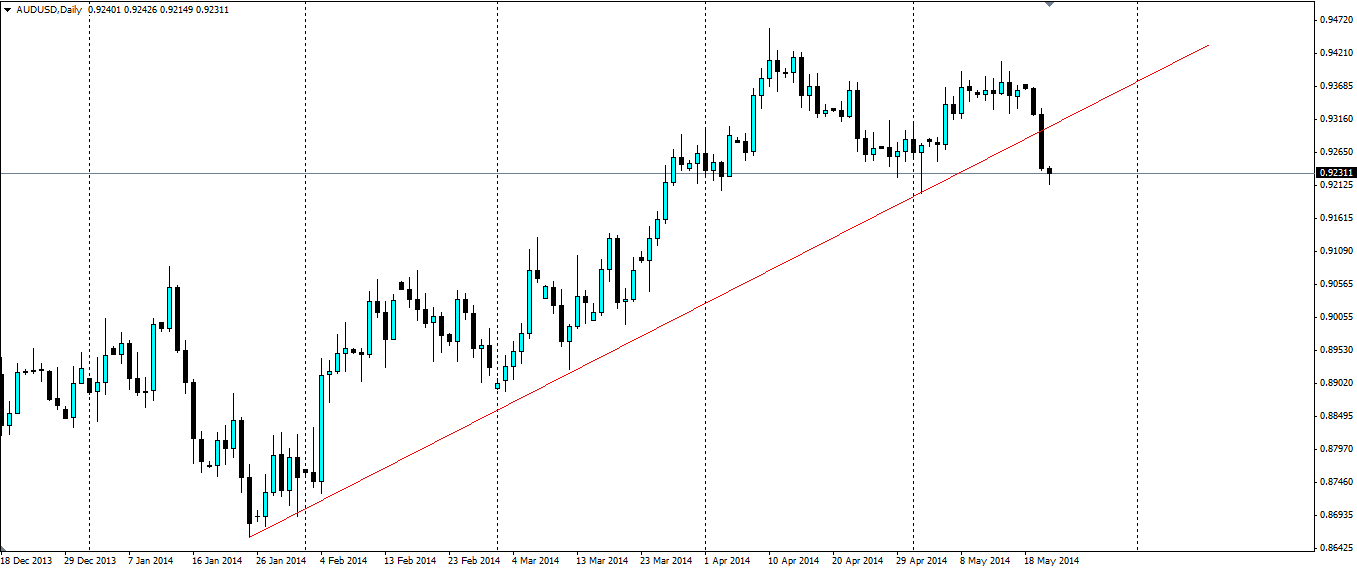
Recent comments by the RBA sent the Aussie dollar through its bullish trend line. With recent economic data pointing to a worsening situation, the Aussie dollar is sure to fall further.

Source: Blackwell Trader
The trend line in question has been in play since the low of 0.8659 was reached in late January and the recent comments by the Reserve Bank of Australia (RBA) sent the price smashing through this line. The RBA released the minutes of its May 6th meeting when it held rates even at 2.5% and had the following to say: “The board noted that overall growth in coming quarters was likely to be below trend given expected slower growth in exports, the decline in mining investment and the planned fiscal consolidation.”
Most importantly, it said: “The current accommodative stance of policy was likely to be appropriate for some time yet.” This signalled to the market that a rate rise is not likely to happen anytime soon, and Australian denominated asset yields will be depressed for longer, dampening the carry trade.
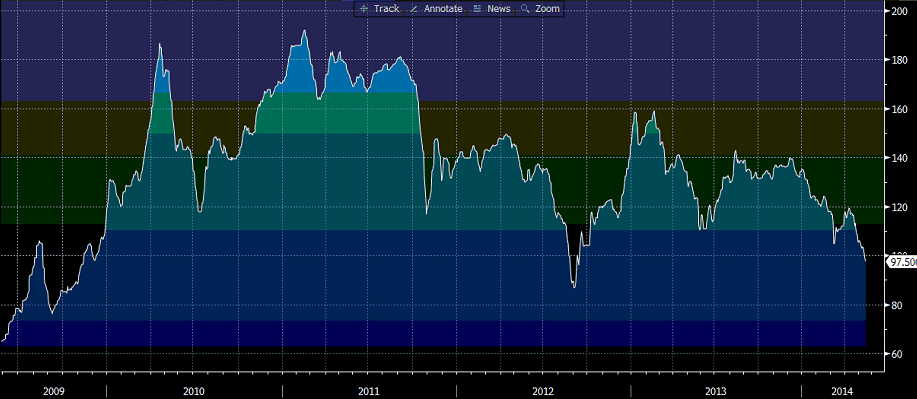
To make matters worse for the Aussie, the price of Iron Ore (ASX:IOH) fell below US$100 a tonne yesterday, the first time since 2012, on fears that demand for steel in the Chinese housing sector could dry up as the economy cools and supply is going to outstrip demand. The record high in 2011, of US$190.00 a tonne is almost double the closing price of US$98.50 a tonne yesterday. The Australian dollar was impacted so heavily because Australia’s largest export earner is by far iron ore, estimated to amount to A$76.8b for the year to June 2014. Out of a total estimated exports of A$330m, iron ore accounts for over 23% of the nation’s earnings.
Iron Ore Spot Price per dry metric tonne (62% Fe, Tianjin Port)

Source: Bloomberg
Traders speculating on the Aussie dollar will be keeping a close eye on the HSBC Manufacturing PMI report due out on Thursday (24/05/2014 01:45 GMT) which market consensus suggests it is likely to show further contraction in the sector for the 5th month in a row. The Australian economy has become rather reliant on China in the last few years; in 2013, China accounted for 36.1% of Australia’s exports and 19.6% of her imports, so any hint of a slowdown in growth in China is going to have a disproportionate effect on the Aussie dollar.
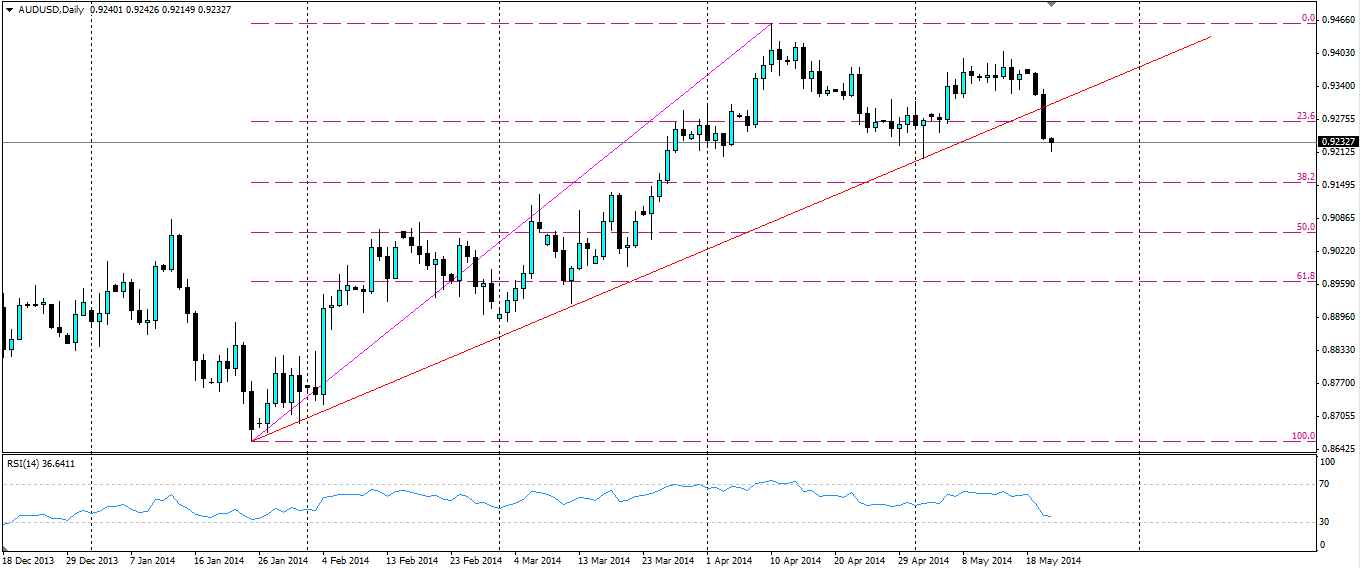
Looking at the below chart, we can see the 23.6% Fib line previously provided some support, however, this has been broken by the recent bearish movement. The 50.0% line looks like the next big target for this pair. The RSI is showing clear momentum with the bears as the price drops, with a value of 36.67, and given the breakdown in the trend line, it looks like there is no bullish pressure left to hold the price from falling further.

Source: Blackwell Trader
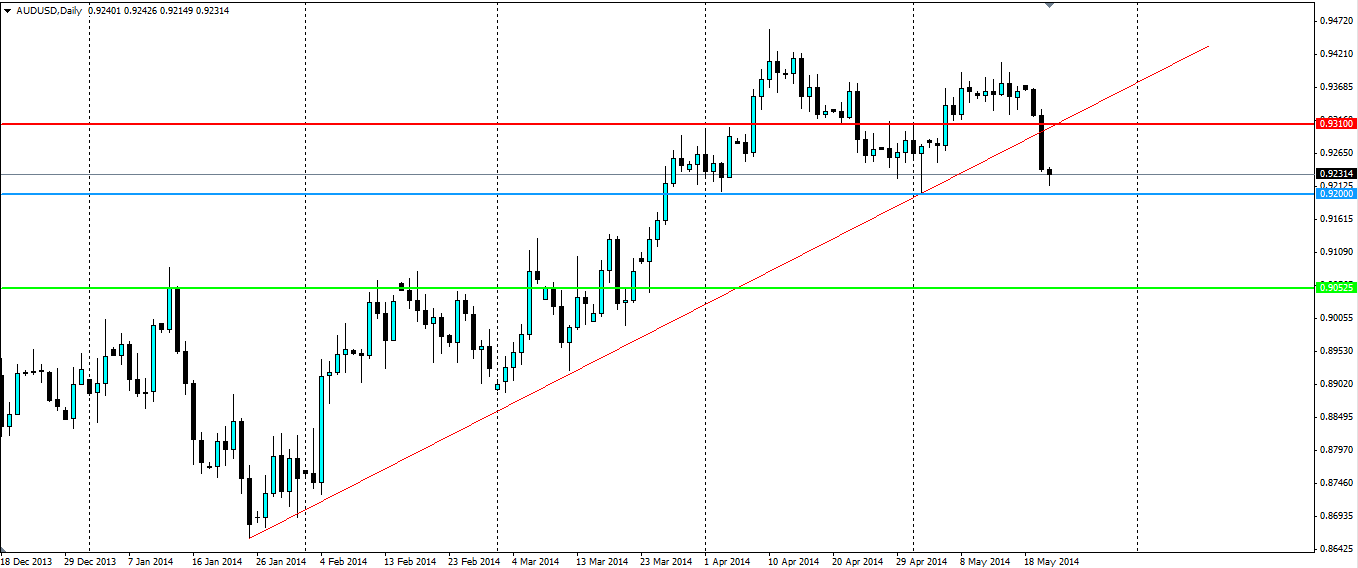
Any traders looking to short this pair should enter when the current support at 0.9200 breaks down, as this could provide a level for a slight pullback. Entering after this support breaks will confirm the down trend and it should quickly head towards the 50.0% Fib line. A stop loss can be set around the 0.9310 level in case this support does hold and the price bounces back towards the trend line. The 50.0% Fib line at around 0.90525 should provide a reasonable target for a short trade as this has provided resistance and support in the previous uptrend.

Source: Blackwell Trader
The current breakdown in the bullish trend for the Australian dollar was due to comments by the RBA and the drop in iron ore prices. Bearish sentiment looks to have taken over and there are signs this pair will fall further.
