
In yesterday's update on demographic trends in employment, I included a chart illustrating the growth (or shrinkage) in six age cohorts since the turn of the century. In this commentary we'll zoom in on the age 50 and older Labor Force Participation Rate (LFPR).
But first, let's review the big picture. The overall LFPR is a simple computation: You take the Civilian Labor Force (people age 16 and over employed or seeking employment) and divide it by the Civilian Noninstitutional Population (those 16 and over not in the military and or committed to an institution). The result is the participation rate expressed as a percent.
For the larger context, here is a snapshot of the monthly LFPR for age 16 and over stretching back to the Bureau of Labor Statistics' starting point in 1948, the blue line in the chart below, along with the unemployment rate.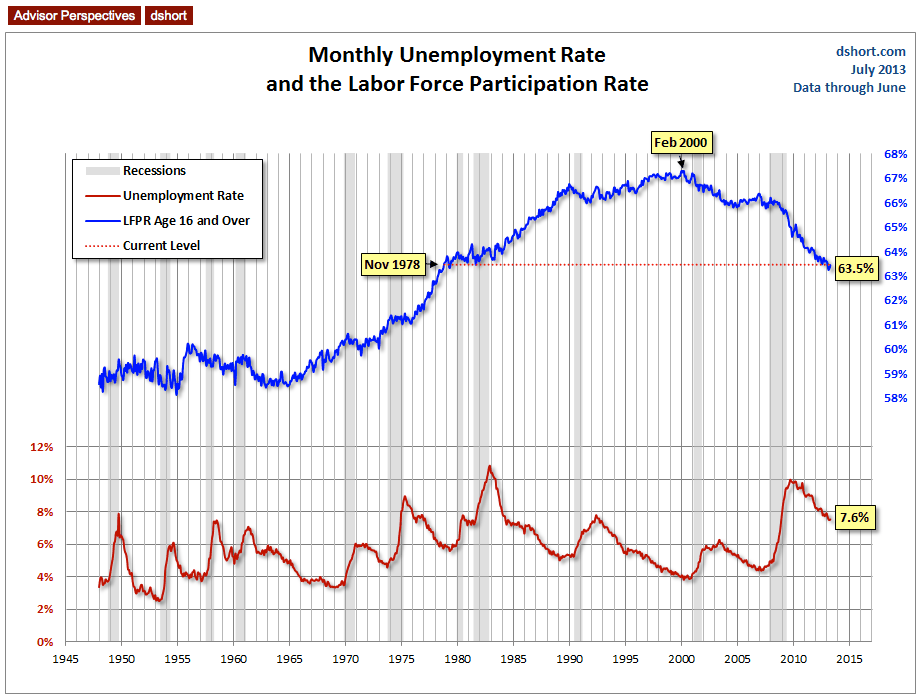
The overall LFPR peaked in February 2000 at 67.3% and gradually began falling. The rate leveled out from 2004 to 2007, but in 2008, with onset of the Great Recession, the rate began to accelerate. In January of 2012 it dropped below 64% and is now hovering around the 63.4% level. The demography of our aging workforce has been a major contributor to this trend. The oldest Baby Boomers, those born between 1946 and 1964, began becoming eligible for reduced Social Security benefits in 2008 and full benefits in 2012. Job cuts during the Great Recession certainly strengthened the trend.
The Growing Ratios Of Older Workers
It might seem intuitive that the participation rate for the older workers would have declined the fastest. But exactly the opposite has been the case. The chart below illustrates the growth of the LFPR for six age 50-plus cohorts since the turn of the century. I've divided them into five-year cohorts from ages 50 through 74 and an open-ended age 75 and older. The pattern is clear: The older the cohort, the greater the growth.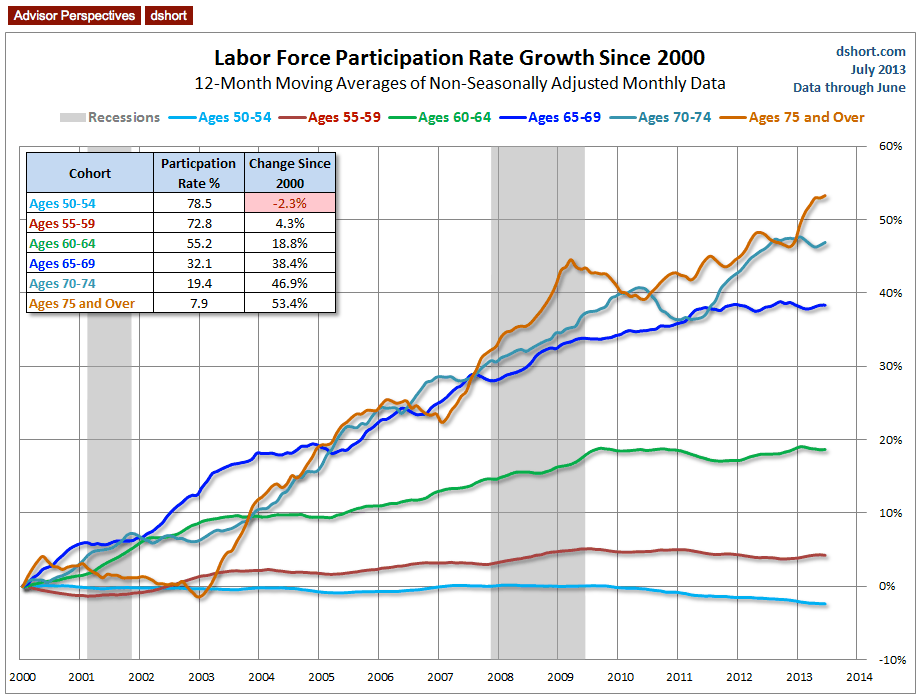
Another Way To Envision The Data
The table inset in the chart above shows the participation rate for the latest month and the percentage growth since January 2000. The adjacent table rounds the rates to integers for January 2000 and for the latest month. Essentially this table gives us two snapshots: The number of workers per hundred for each of the six cohorts at the turn of the century and the number of workers per hundred now. This is not the scenario that would have been envisioned a generation ago for the "Golden Years" of retirement. Consider: Today nearly one in three of the 65-69 cohort and almost one in five of the 70-74 cohort are in the labor force.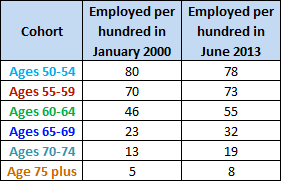
There is no question that the pace of Boomer retirement will accelerate in the years ahead. Just add about 65 years to the red dots in the chart below and you'll get some idea of the epic retirement wave that is just beginning (and note that the birth statistics below don't include immigration).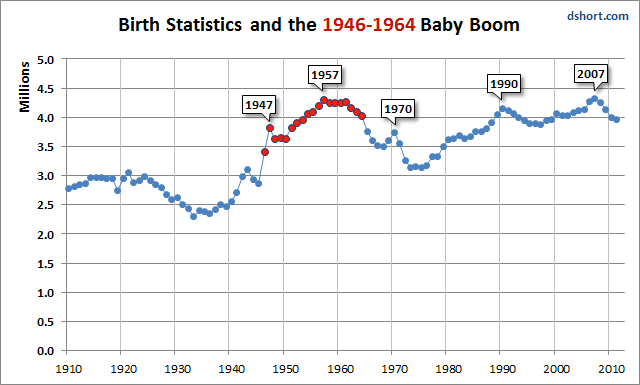
What's Ahead?
With the improvement in the market since the 2009 index lows, many households approaching the traditional retirement age are in better financial shape and with healthier nest eggs than was the case a few years ago. On the other hand, when we look at the age 65-69 cohort, the dark blue line in the second chart above, we see that it rose steadily between the last two recessions despite the market's improvement, although it appears to be leveling out over the past 18 or so months. If we can avoid a near-term recession and the economy and the market continue to improve, perhaps the participation rates of the older cohorts will gradually reverse directions. That would certainly improve the job opportunities of younger generations.
- English (UK)
- English (India)
- English (Canada)
- English (Australia)
- English (South Africa)
- English (Philippines)
- English (Nigeria)
- Deutsch
- Español (España)
- Español (México)
- Français
- Italiano
- Nederlands
- Português (Portugal)
- Polski
- Português (Brasil)
- Русский
- Türkçe
- العربية
- Ελληνικά
- Svenska
- Suomi
- עברית
- 日本語
- 한국어
- 简体中文
- 繁體中文
- Bahasa Indonesia
- Bahasa Melayu
- ไทย
- Tiếng Việt
- हिंदी
That's One Amazing Demographic Trend!
Published 07/10/2013, 11:49 AM
Updated 07/09/2023, 06:31 AM
That's One Amazing Demographic Trend!
Note from dshort: I’ve updated the age cohort chart in this commentary to include the latest data in Friday’s employment report for June.
3rd party Ad. Not an offer or recommendation by Investing.com. See disclosure here or
remove ads
.
Latest comments
Install Our App
Risk Disclosure: Trading in financial instruments and/or cryptocurrencies involves high risks including the risk of losing some, or all, of your investment amount, and may not be suitable for all investors. Prices of cryptocurrencies are extremely volatile and may be affected by external factors such as financial, regulatory or political events. Trading on margin increases the financial risks.
Before deciding to trade in financial instrument or cryptocurrencies you should be fully informed of the risks and costs associated with trading the financial markets, carefully consider your investment objectives, level of experience, and risk appetite, and seek professional advice where needed.
Fusion Media would like to remind you that the data contained in this website is not necessarily real-time nor accurate. The data and prices on the website are not necessarily provided by any market or exchange, but may be provided by market makers, and so prices may not be accurate and may differ from the actual price at any given market, meaning prices are indicative and not appropriate for trading purposes. Fusion Media and any provider of the data contained in this website will not accept liability for any loss or damage as a result of your trading, or your reliance on the information contained within this website.
It is prohibited to use, store, reproduce, display, modify, transmit or distribute the data contained in this website without the explicit prior written permission of Fusion Media and/or the data provider. All intellectual property rights are reserved by the providers and/or the exchange providing the data contained in this website.
Fusion Media may be compensated by the advertisers that appear on the website, based on your interaction with the advertisements or advertisers.
© 2007-2024 - Fusion Media Limited. All Rights Reserved.