Terex Corporation (TEX) is a diversified global equipment manufacturer of a variety of machinery products. Terex is focused on delivering customer-driven solutions for a range of commercial applications, including the construction, infrastructure, quarrying, mining, shipping, transportation, refining, energy and utility industries.
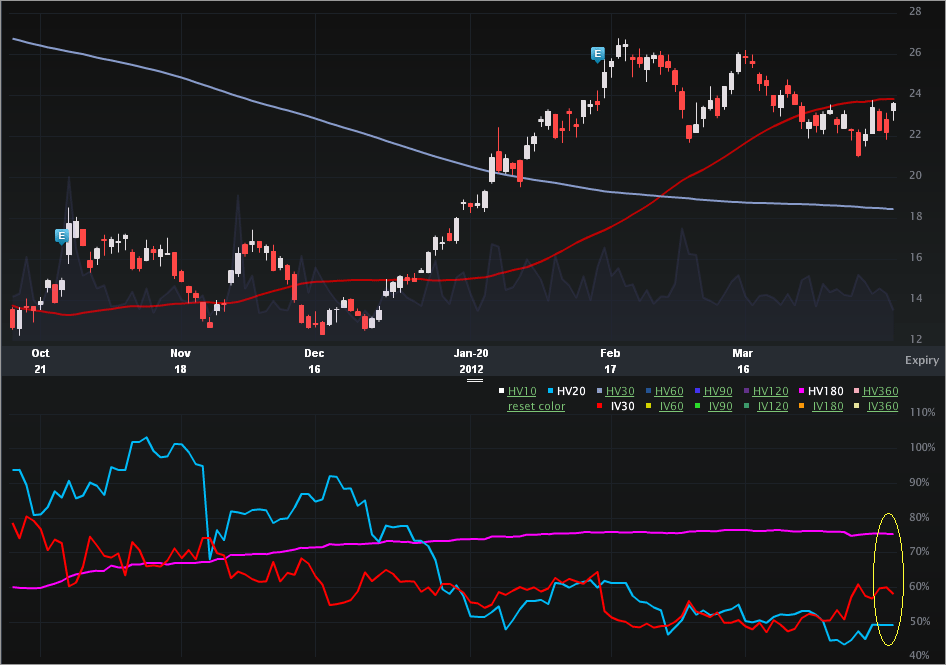
This is a vol note as earnings approach on an ambiguous date. The end result is an interesting vol level if either of two realistic opportunities arise. Let’s start with the Charts Tab (six months), below. The top portion is the stock price, the bottom is the vol (IV30™ - red vs HV20™ - blue vs HV180™ - pink).
On the stock side we can see an abrupt move up over the last few months. On 12-28-2011 the stock closed at $12.63. As of this writing, the stock is up 86.9% since then. Most of that move came from late Dec to mid Feb – check out that straight line up. Since then, there has been a bit of an equilibrium found, or in English, some sideways trading.
On the vol side, we can see how the implied has been higher, substantially so, over the last six months. The 52 wk range in IV30™ is [33.11%, 98.13%], putting the current level in the 38th percentile. The last two earnings cycles for TEX in calendar Q2 have been 4-21-2010 and 4-20-2011. That makes for difficult timing as Apr expiry is 4-20-2012.
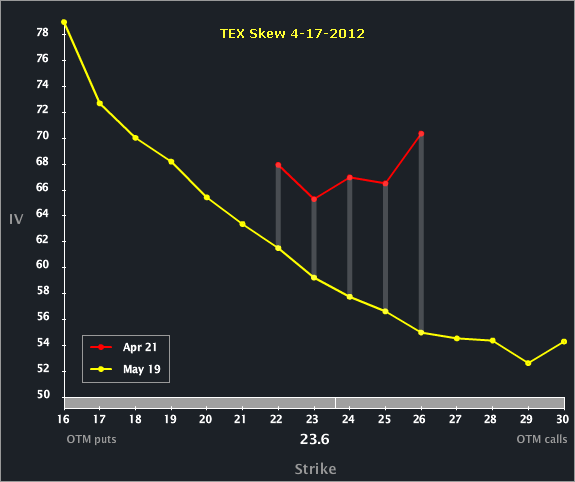
Let’s turn to the Skew Tab.
We can see that Apr is well elevated to May across all of the strikes. This is sort of circumstantial evidence that earnings are due out before expiry. Looking to the firm’s IR site, I see this disclaimer: “There are currently no events scheduled.” Umm, I think there should be pretty soon, no?...
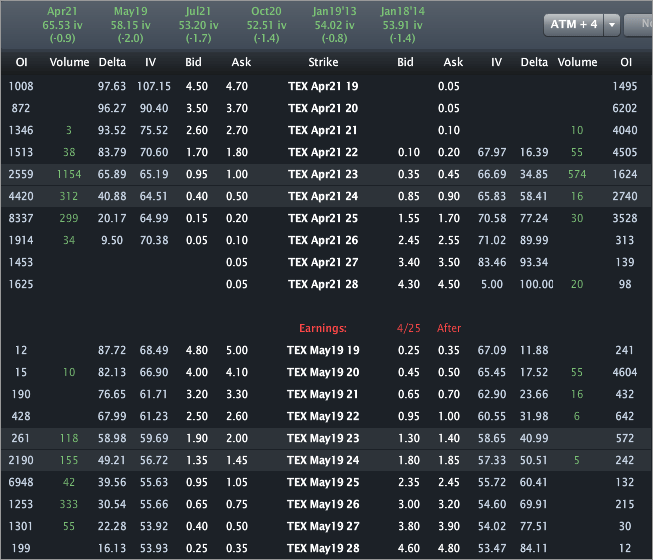
Finally, let’s turn to the Options Tab, for completeness.
I wrote about this one for TheStreet (OptionsProfits), so no specific trade analysis here. We can see that Apr is priced to 65.53% vol, while May is priced to 58.15%. What’s interesting about these levels is that they both feel low. If earnings were in Apr, then the remaining week is essentially a pure earnings play, in which case vol would be substantially higher. If we consider the day of earnings just twice as “risky” as a “normal day,” we would expect vol in the 100% range. If, on the other hand, earnings fall in May, that 38th percentile also feels low. A very odd phenomenon IMHO, right now.
This is trade analysis, not a recommendation.
- English (UK)
- English (India)
- English (Canada)
- English (Australia)
- English (South Africa)
- English (Philippines)
- English (Nigeria)
- Deutsch
- Español (España)
- Español (México)
- Français
- Italiano
- Nederlands
- Português (Portugal)
- Polski
- Português (Brasil)
- Русский
- Türkçe
- العربية
- Ελληνικά
- Svenska
- Suomi
- עברית
- 日本語
- 한국어
- 简体中文
- 繁體中文
- Bahasa Indonesia
- Bahasa Melayu
- ไทย
- Tiếng Việt
- हिंदी
Terex: Oddity in Earnings Vol, Whenever It Occurs
Published 04/18/2012, 04:18 AM
Updated 07/09/2023, 06:31 AM
Terex: Oddity in Earnings Vol, Whenever It Occurs
3rd party Ad. Not an offer or recommendation by Investing.com. See disclosure here or
remove ads
.
Latest comments
Install Our App
Risk Disclosure: Trading in financial instruments and/or cryptocurrencies involves high risks including the risk of losing some, or all, of your investment amount, and may not be suitable for all investors. Prices of cryptocurrencies are extremely volatile and may be affected by external factors such as financial, regulatory or political events. Trading on margin increases the financial risks.
Before deciding to trade in financial instrument or cryptocurrencies you should be fully informed of the risks and costs associated with trading the financial markets, carefully consider your investment objectives, level of experience, and risk appetite, and seek professional advice where needed.
Fusion Media would like to remind you that the data contained in this website is not necessarily real-time nor accurate. The data and prices on the website are not necessarily provided by any market or exchange, but may be provided by market makers, and so prices may not be accurate and may differ from the actual price at any given market, meaning prices are indicative and not appropriate for trading purposes. Fusion Media and any provider of the data contained in this website will not accept liability for any loss or damage as a result of your trading, or your reliance on the information contained within this website.
It is prohibited to use, store, reproduce, display, modify, transmit or distribute the data contained in this website without the explicit prior written permission of Fusion Media and/or the data provider. All intellectual property rights are reserved by the providers and/or the exchange providing the data contained in this website.
Fusion Media may be compensated by the advertisers that appear on the website, based on your interaction with the advertisements or advertisers.
© 2007-2024 - Fusion Media Limited. All Rights Reserved.
