We have seen some really big moves in various S&P sectors over the past 60+ days and these trends look like they may continue for a while. Near the end of 2020, in October and November, the markets seemed to stall a bit before the US elections, but they have really started to trend much higher over the past 60+ days. Technology and Energy seem to be leading the charge in some respects. The most important thing for traders is to find decent breakout trends in stocks and sectors that have a real potential for strong continued trending. When we find these types of longer-term trends, we can scale in and out of the typical up/down price trends, over time, to generate some incredible returns.
Technology Heating Up Again
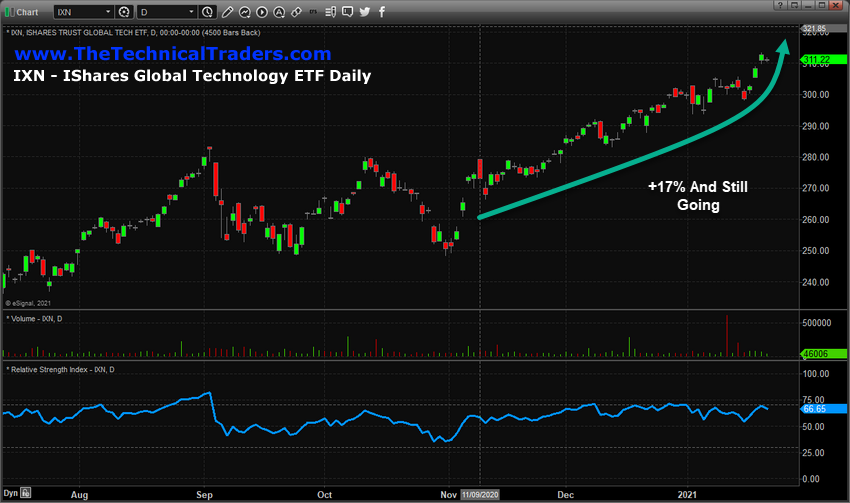
The move in the iShares Global Tech ETF (NYSE:IXN), charted below, looks like it is starting to accelerate higher. It has already moved +17% over the past 60+ days, but there is a real potential that global investors are starting to pile back into technology ahead of the Q4:2020 earnings reports. This may prove to be one of the hottest sectors in 2021 – so keep an eye on this new breakout rally.

Energy and Exploration Setting Up For Another Move Higher
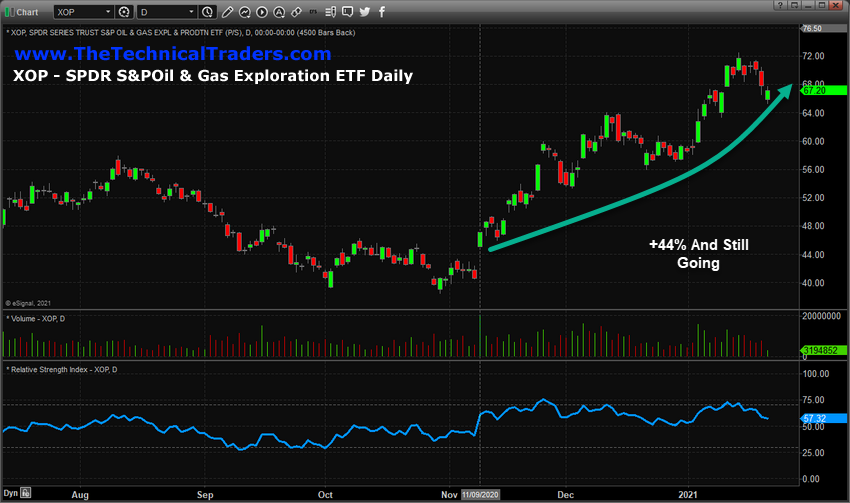
One of the biggest movers over the past few months has been the recovery of the Oil/Gas/Energy sector after quite a bit of sideways/lower price trending. You can see from this SPDR® S&P Oil & Gas Exploration & Production ETF (NYSE:XOP) chart, below, a 44% upside price rally has taken place since early November, and XOP has recently rotated moderately downward—setting up another potential trade setup if this rally continues. Traders know, the trend is your friend. Another upside price swing in the XOP, above $72, would suggest this rally mode is continuing.

Recently, we published a research article suggesting a lower US Dollar would prompt major sector rotations in the US and global markets where we highlighted the fact that the Materials, Industrials, Technology, and Discretionary sectors had been the hottest sectors of the past 180 days, but the Energy, Financials, Materials, and Industrials had shown the best strength over the past 90 days.
Technology, Healthcare, Financials, Energy, Consumer Products/Services, Foreign Markets have all been hot over the past 4+ months, but what is trending right now? We believe the best performing sectors are likely to be sub-sectors of the SPDR S&P 500 (NYSE:SPY) and Invesco QQQ Trust (NASDAQ:QQQ). My research team and I believe Technology and Energy still have lots of room to run. Financials could be a big winner too if the recent upside trend continues.
