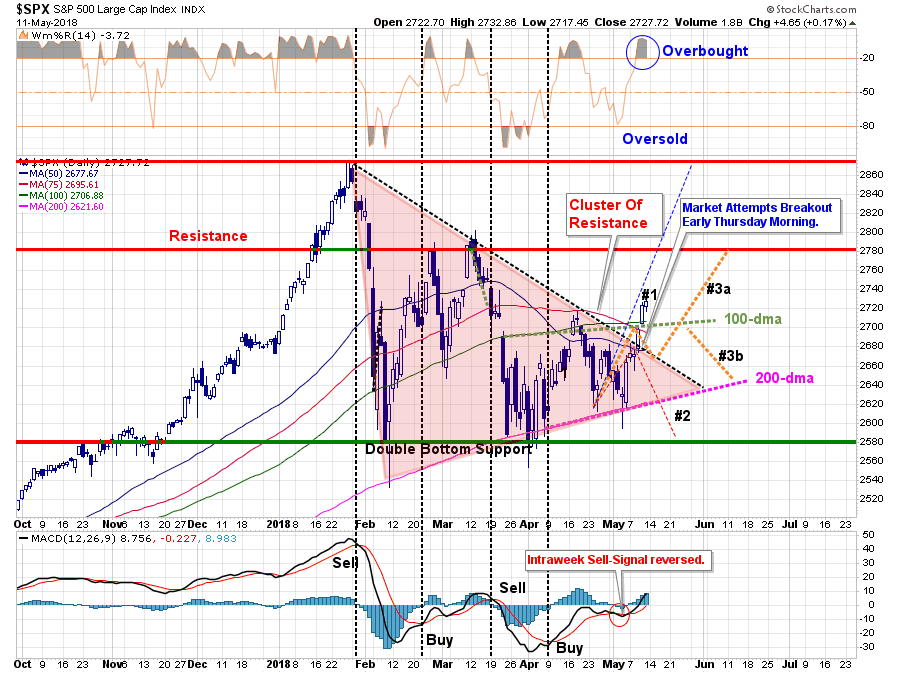
In this past weekend’s newsletter, I updated our previous analysis for the breakout of the consolidation process, which has been dragging on for the last couple of months. To wit:
From a bullish perspective there are several points to consider:
- The short-term ‘sell signal’ was quickly reversed with the breakout of the consolidation range.
- The break above the cluster of resistance (75- and 100-dma and closing high downtrend line) clears the way for an advance back to initial resistance at 2780.
- On an intermediate-term basis the “price compression” gives the market enough energy for a further advance.
With the market close on Friday, we do indeed have a confirmed breakout of the recent consolidation process. Therefore, as stated previously, we reallocated some of our cash back into the equity side of our portfolios.
It’s now time to make our next set of “guesstimates.”
With the market back to very short-term “overbought” territory, a bit of a pause is likely in order. We currently suspect, with complacency and bullish optimism quickly returning, a further short-term advance toward 2780 is likely.
- Pathway #1 suggests a break above the next resistance level will quickly put January highs back in view. (20% probability)
- Pathway #2a shows a rally to resistance, with a pullback to support at the 100-dma, which allows the market to work off some of the short-term overbought condition before making a push higher. (30% probability)
- Pathway #2b suggests the market continues a consolidation process into the summer building a more protracted “pennant” formation. (30% probability)
- Pathway #3 fails support at the 100-dma and retests the 200-dma. (20% probability)
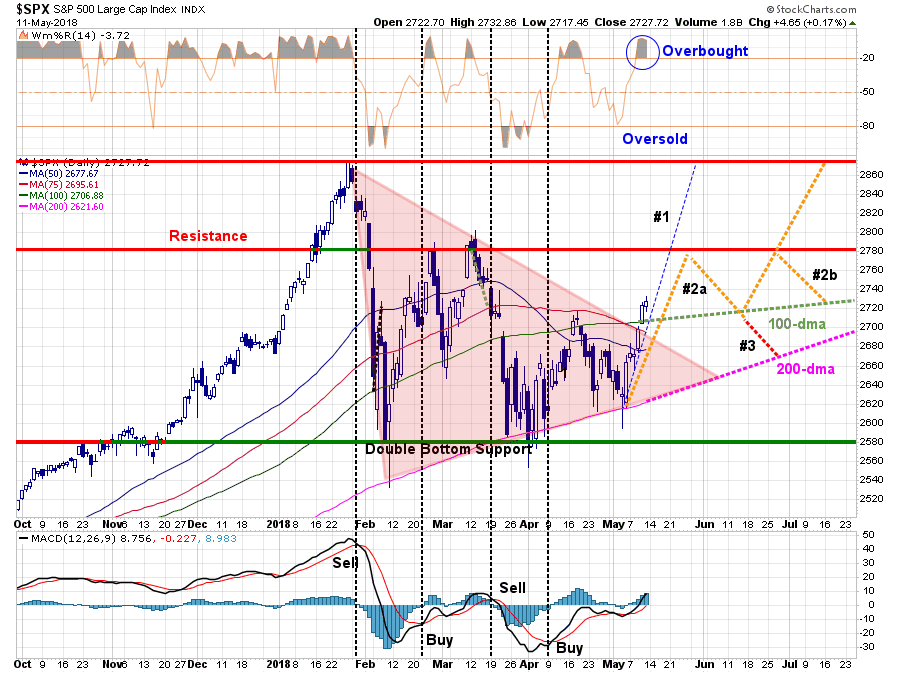
Again, these are just guesses out of a multitude of potential variations in the future. The reality is that no one knows for sure where the market is heading next. These pathways are simply an educated guess upon which we can begin to make some portfolio-management decisions related to allocations, risk controls, cash levels and positioning.
Yet while the short-term backdrop is bullish, there is also a rising probability this could be a trap.
"But, while ‘everyone loves a good bullish thesis,’ let me restate the reduction in the markets previous pillars of support:
- The Fed is raising interest rates and reducing their balance sheet.
- The yield curve continues to flatten and risks inverting.
- Credit growth continues to slow suggesting weaker consumption and leads recessions
- The ECB has started tapering its QE program.
- Global growth is showing signs of stalling.
- Domestic growth has weakened.
- While EPS growth has been strong, year-over-year comparisons will become challenging.
- Rising energy prices are a tax on consumption
- Rising interest rates are beginning to challenge the valuation story.
While there have been several significant corrective actions since the 2009 low, this is the first correction process where liquidity is being reduced by the Central Banks."
– Lance Roberts
In 2015-2016 we saw a similar rally off of support lows that failed and ultimately set new lows before global central banks sprung into action to inject liquidity. As I have said before, had it not been for those globally coordinated interventions, it is quite likely the market and the economy would have experienced a much deeper corrective process.
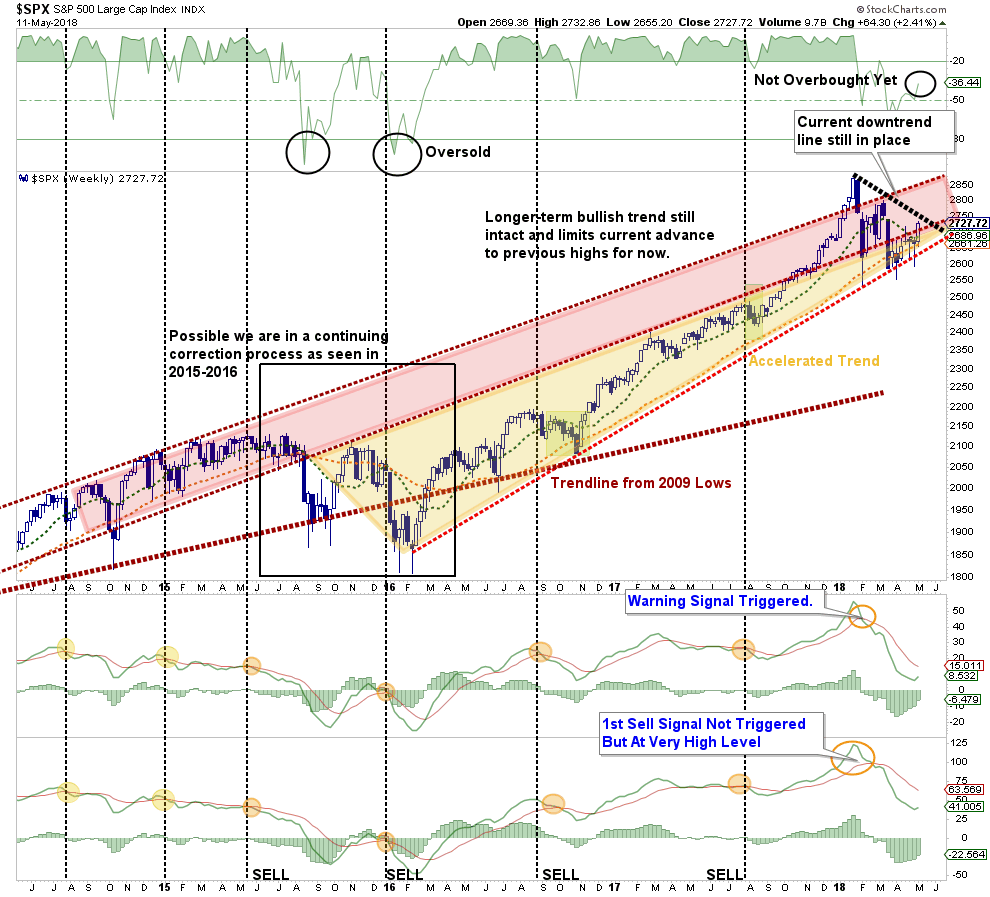
While the markets have indeed gone through a correction over the last couple of months, there is no evidence yet that central banks are on the verge of ramping up liquidity. Furthermore, the synchronized global economic growth cycle has begun to show globally synchronized weakness. This is particularly the case in the U.S. as the boost from the slate of natural disasters last year is fading.
More importantly, on a longer-term basis, the recent corrective process is the same as what we saw in previous market-topping processes.
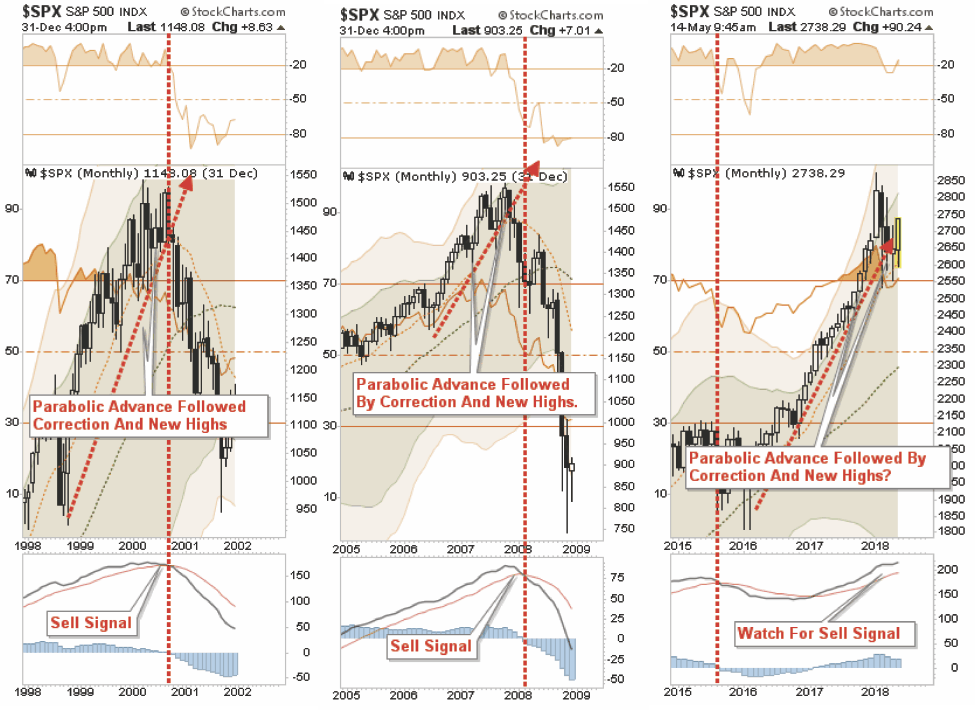
In each of the previous cases, the market experienced a parabolic advance to the initial peak. A correction ensued that was dismissed by the mainstream media, and investors too, as just a pause that refreshes. They were seemingly proved correct as the markets rebounded shortly thereafter and even set all-time highs. Investors, complacent in the belief that “this time is different” (1999 – new paradigm, 2007 – Goldilocks economy), continued to hold out hopes that the bull market was set to continue.
That was a mistake.
The difference, in both of the previous cases, was the Federal Reserve had shifted its stance from accommodative monetary policy to restrictive, by increasing interest rates to combat the fears of inflation and a potential for the economy to overheat.
As stated in our list of concerns above, the Federal Reserve remains our biggest flashpoint for the continuation of the bull market.
Furthermore, the surge in stock buybacks to pay for stock-option grants is also worrisome. While such activity will boost markets in the short-term, there is a longer-term negative consequence. As Barron’s put it:
Standard & Poor’s 500 companies are on track to announce $650 billion worth of buybacks this year, according to a Goldman Sachs (NYSE:GS) estimate, smashing the previous record of $589 billion set in 2007.
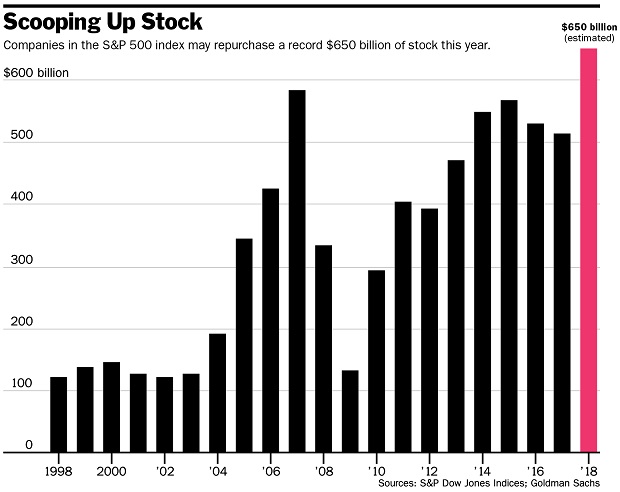
But as Societe Generale (PA:SOGN) noted, those buybacks may boost stock prices temporarily but are not likely to show up in the economy longer-term.
We recognize that calculating the stock option effect is an educated guess as we look at the amount repurchased versus the actual reduction in the share count and assume the difference is the option issuance effect (though issuance can be for other reasons).
It looks like the bulk of last quarter’s repurchases went on stock options (aka wages). But looking at the table below it appears as if buybacks have indeed gone to pay higher wages, but we suspect not in the way policymakers hand in mind.
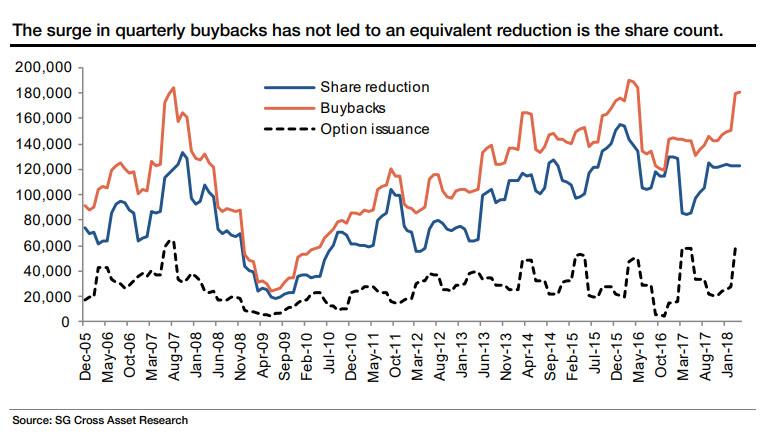
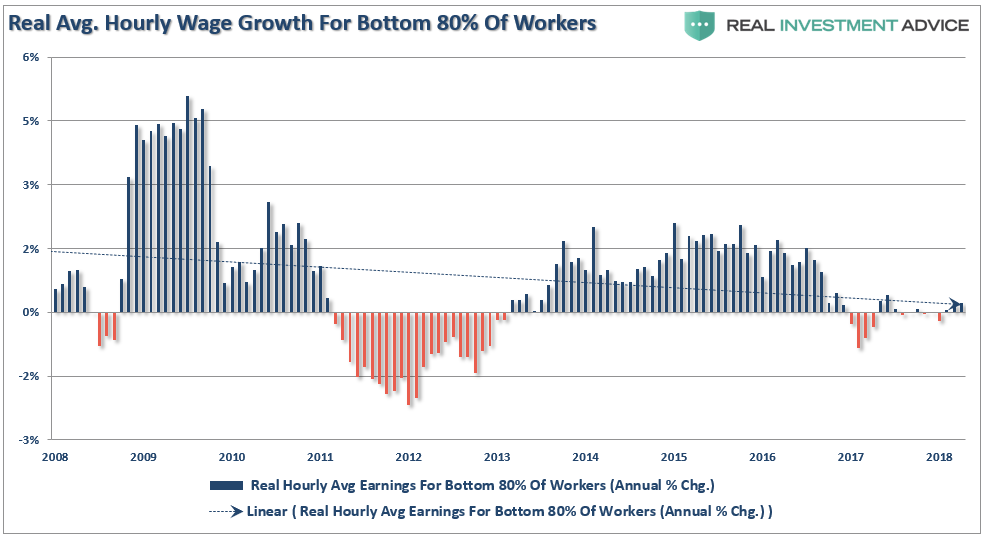
Such is a critical point considering that ultimately revenues are driven by economic growth of which 70% is derived from consumption. Boosting wages for the top 20% of wage earners is not likely to lead to stronger rates of economic growth.
With year-over-year earnings comparisons set to fall beginning in the third quarter of this year, another support of the bull market thesis is being removed.
The biggest challenge of portfolio management is weaving short-term price dynamics (which is solely market psychology) into a long-term fundamentally and economically driven investment thesis.
Yes, with the breakout of the consolidation process last week, we did indeed add exposure to our portfolios as our investment discipline dictates. But such does not mean that we have dismissed our assessment of the risks that currently prevail.
There is a rising possibility that the current rally is a bull trap rather than the start of a new leg in this aging bull market.
That's why we still maintain slightly higher levels of cash holdings in our accounts, remain focused on quality and liquidity and keep very tight risk controls in place.
