- All Instrument Types
- Indices
- Equities
- ETFs
- Funds
- Commodities
- Currencies
- Crypto
- Bonds
- Certificates
Please try another search

Technically Speaking For October 9

Summary- The IMF is still forecasting solid growth, but downside risks have increased.
- Chinese-US relations have soured of late; China is pumping money into its economy.
- The markets are trying to bottom around the 200-day EMAs.
The International Monetary Fund released their latest global economic forecasts yesterday. Although the tone was generally positive, it observed that two risks had developed. The first one is an increased difficulty for emerging markets that were exposed to the rising dollar. The report specifically noted that Turkey, Argentina, and South Africa had this problem. The IMF also noted that this event was so far contained to the relevant countries. The second risk was (unsurprisingly) increased trade riffs caused by Trump’s implementation of tariffs on key U.S. trading partners. Sentiment reports have registered an uptick in concern on behalf of policymakers as a result of the rising wave of protectionism. This could lead to decreased or delayed spending plans on the part of businesses.
Sino–American relations are deteriorating. The U.S. Secretary of State and his Chinese counterpart recently traded public barbs. Recent accusations of election interference voiced by President Trump and Vice President Pence exacerbated tensions. Now, China is demanding that the U.S. specifically designate who has authority to negotiate on its behalf. Military tensions are also rising, with the U.S. sanctioning a Chinese company for its dealings with a Russian supplier and U.S. and Chinese warships sailing in increasing proximity in the South China Sea. Should this situation continue unaddressed, it is only a matter of time before something really stupid happens.
And speaking of China, the Chinese government has signaled it is pumping $175 billion into its economy:
On Sunday, Beijing went one step further.
The People’s Bank of China, the central bank, pulled a financial lever that will effectively pump $175 billion into the economy. The government is aiming to help small and midsize businesses in particular, which have had trouble obtaining loans and face other rising pressures.
So far, the official statistics are still pretty solid: GDP growth at 6.7%, inflation at 2.3%, unemployment below 4%, retail sales are 9% Y/Y, and industrial production is 6.1% Y/Y. It's more than likely that the government is privy to some concerning non-public information. It's also likely that they are doing this preemptively. And, they have plenty of additional fiscal ammunition if they want to apply it. This does, however, signal that the economy might be in worse shape than thought.
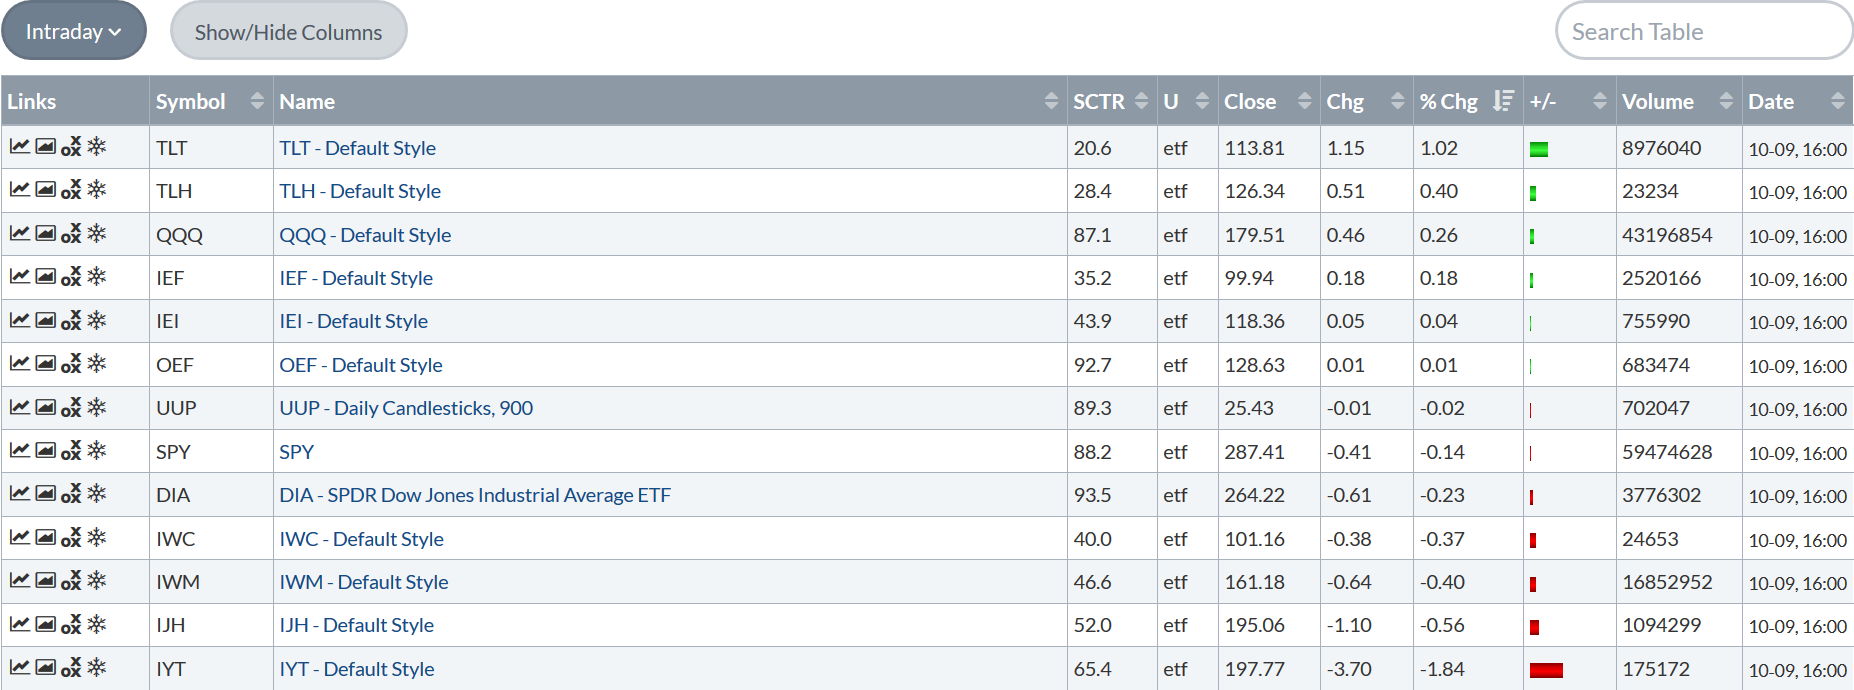
Yesterday, the markets looked like they were trying to form a bottom after last week's sell-off. Let's see how we did:
It could be a whole lot better. The Invesco QQQ Trust Series 1 (NASDAQ:QQQ) were the best performer; they were only up .26%. The OEF was up marginally. Everybody else was down. Worst still, the iShares Micro-Cap (NYSE:IWC), iShares Russell 2000 (NYSE:IWM), and iShares S&P Midcap 400 (NYSE:IJH) were all lower. On the plus side, they weren't down that much.
The charts are actually pretty decent, however.
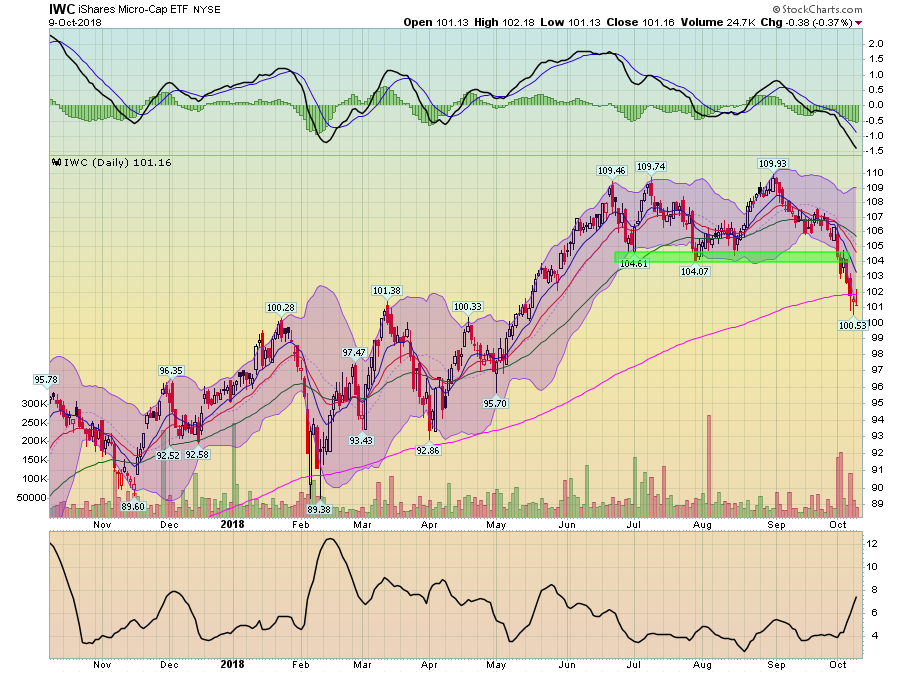
The micro-caps are clustering around the 200-day EMA and the last two days they've printed weak bearish bars. It looks like they really want to use the 200-day EMA as technical support.
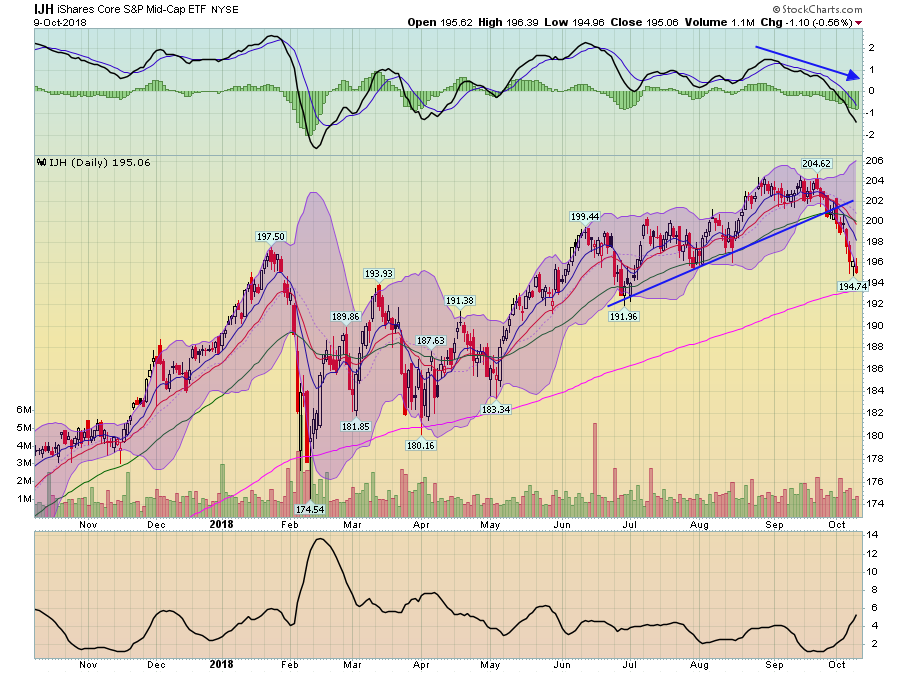
The IJHs continue to head lower but are still above the 200-day EMA. Like the IWCs, it looks like they are targeting the 200-day EMA.
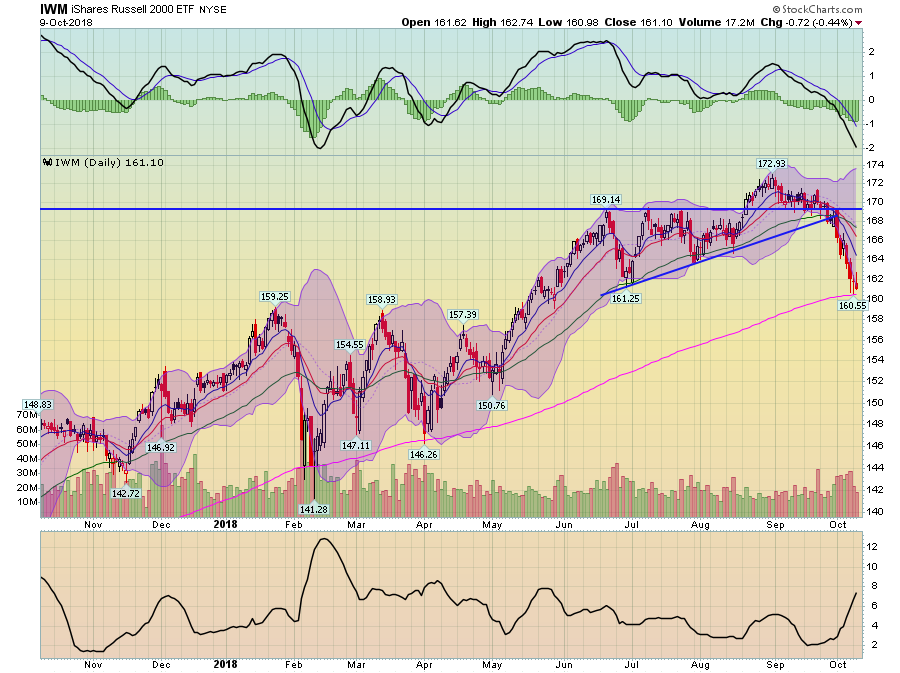
The same story with the IWMs.
All in all, we're actually not in bad shape. The key going forward is if the 200-day EMAs hold as support. That's what we'll need to keep our eye on.
Disclosure:I/we have no positions in any stocks mentioned, and no plans to initiate any positions within the next 72 hours.
I wrote this article myself, and it expresses my own opinions. I am not receiving compensation for it (other than from Seeking Alpha). I have no business relationship with any company whose stock is mentioned in this article.
Related Articles

If there was a "Stock of the Year" award, it would certainly go to Nvidia (NASDAQ:NVDA). As a result of the continued AI boom, the market cap of this semiconductor manufacturer...

A data provider tracks the stocks trades of members of Congress An asset management firm created two ETFs tracking how Congress members invest The Democratic and...

Below we can see how the top stocks in the S&P 500, as tracked by the Invesco S&P 500® Top 50 ETF (NYSE:XLG), have gained 22.5% in 2024. That easily beats the SPDR®...
Are you sure you want to block %USER_NAME%?
By doing so, you and %USER_NAME% will not be able to see any of each other's Investing.com's posts.
%USER_NAME% was successfully added to your Block List
Since you’ve just unblocked this person, you must wait 48 hours before renewing the block.
I feel that this comment is:
Thank You!
Your report has been sent to our moderators for review


Add a Comment
We encourage you to use comments to engage with other users, share your perspective and ask questions of authors and each other. However, in order to maintain the high level of discourse we’ve all come to value and expect, please keep the following criteria in mind:
Enrich the conversation, don’t trash it.
Stay focused and on track. Only post material that’s relevant to the topic being discussed.
Be respectful. Even negative opinions can be framed positively and diplomatically. Avoid profanity, slander or personal attacks directed at an author or another user. Racism, sexism and other forms of discrimination will not be tolerated.
Perpetrators of spam or abuse will be deleted from the site and prohibited from future registration at Investing.com’s discretion.