Summary- The Fed signaled it's going to cut rates.
- Greece is still an economic mess.
- While the Fed signaled a more dovish stance, the markets didn't perform in the most bullish manner.
Fed Chair Powell has all but said a rate cute is coming. From today's testimony (emphasis added):
Since our May meeting, however, these crosscurrents have reemerged, creating greater uncertainty. Apparent progress on trade turned to greater uncertainty, and our contacts in business and agriculture report heightened concerns over trade developments. Growth indicators from around the world have disappointed on net, raising concerns that weakness in the global economy will continue to affect the U.S. economy. These concerns may have contributed to the drop in business confidence in some recent surveys and may have started to show through to incoming data.
In our June meeting statement, we indicated that, in light of increased uncertainties about the economic outlook and muted inflation pressures, we would closely monitor the implications of incoming information for the economic outlook and would act as appropriate to sustain the expansion. Many FOMC participants saw that the case for a somewhat more accommodative monetary policy had strengthened. Since then, based on incoming data and other developments, it appears that uncertainties around trade tensions and concerns about the strength of the global economy continue to weigh on the U.S. economic outlook. Inflation pressures remain muted.
It's important to note that trade tensions are the primary cause of the slowdown and that the problems started internationally. International weakness can be transmitted into the US through several channels: financial markets, which are more likely to trade in tandem as the world is more interconnected; trade channels; currency markets; and domestic sentiment, which eventually weighs on decisions.
Remember Greece -- that peripheral EU country that almost caused a second global economic crisis? They recently had a peaceful transfer of power from the political left to the political right. The country is still a mess. The country's first recession lasted from 2008 through the end of 2012. This was followed by an additional four-quarter contraction from 2H15-1H16. Industrial production didn't start growing until late 2015. The unemployment rate was greater than 25% until early 2015 and is still greater than 18%. Retail sales didn't turn positive until mid-2016. The new administration certainly has its hands full.
Here's how the Fed described the recent global tech slowdown:
The global tech cycle—a synchronized pattern of production and trade in electronics and software across economies—has also contributed to the decline in global trade and manufacturing growth. This cycle is particularly important for emerging Asia, where about one-third of exports are technology related. Global semiconductor sales surged in 2017 but fell sharply in the last months of 2018 (figure C). The fall in large part reflected a contraction in demand in China, particularly evident in mobile phone purchases. Recent data, however, suggest that this cycle may have bottomed out, as Chinese mobile phone production picked up in April along with exports of electronics in emerging Asia through May.
Here is the accompanying chart:

The report doesn't tie the slowdown into the trade war. But it's hard not to intuitively link the two, especially as China -- the primary target of US trade attacks -- was the primary source of the slowing demand.
Let's turn to today's performance tables, starting with the indexes:
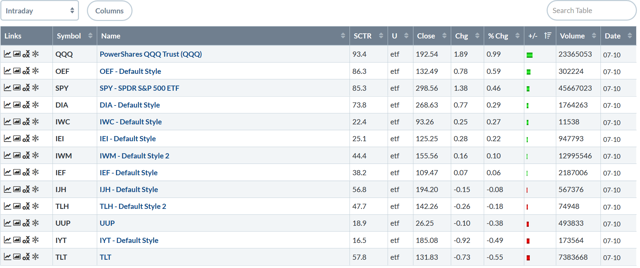
As usual, we continue to have the large-cap/small-cap performance split. Large-caps did fairly well: the QQQ rose almost 1%. But the OEF and SPY increased 0.59% and 0.46%, respectively -- not exactly the size of gain you'd expect on a day when the Fed all but said a rate cut is coming. Then we have the smaller-cap indexes: the IWM rose 0.27%, the IWM was up 0.1%, and the IJH was off marginally. These are not indicative of strong bullish sentiment.
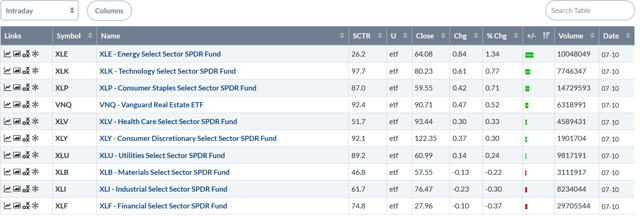
And then we have the sector table:
Energy and technology were the top two performers. But they were followed by three defensive sectors: staples, real estate, and health care. Staples rallied almost as much as tech. They are followed by discretionary. But utilities are the next best performer. This is not exactly the most bullish table ever.
The five-day charts are less than encouraging:
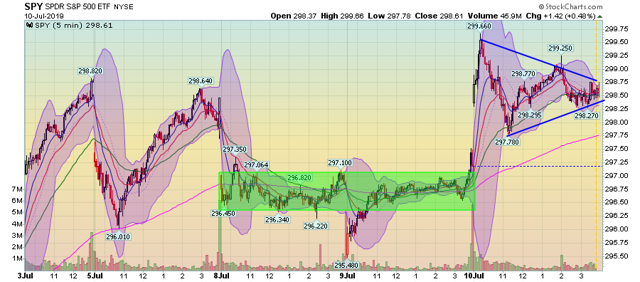
The SPY gapped higher at the open and hit an all-time high. Then prices consolidated in a triangle pattern for the rest of the session. This isn't the chart I'd expect given the Fed's news.
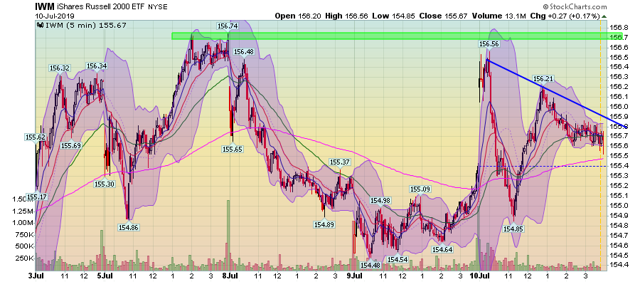
Small-caps gapped higher at the open but then fell below yesterday's close. They rallied again, but couldn't get above the morning's high. Prices then trended lower for the rest of the day.
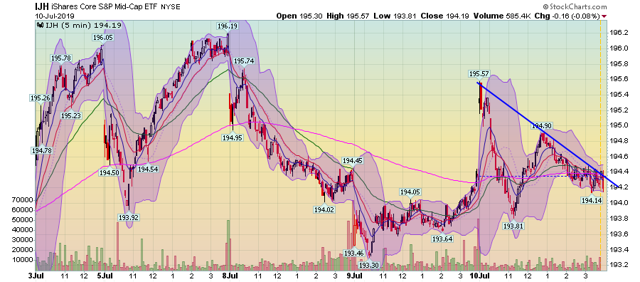
Mid-caps have the same pattern as small-caps. But the IJH closed down fractionally.
There's an old trader's adage: don't fight the Fed. But, it looks like small and mid-caps are doing just that, which is a head-scratcher.

