
Technically Speaking For April 2
Summary
- Brexit is still a large risk on the global economic horizon.
- The WTO is predicting lower global growth in 2019-2020.
- The rally is still weak.
So - where are we in the Brexit process? Nowhere good. Yesterday, Parliament voted down multiple possible plans and solutions. The EU's chief Brexit negotiator said that a hard Brexit was increasingly likely while Teresa May's cabinet convened crisis talks. As I noted on Twitter over the weekend, Brexit has all the makings of an event that will cause a recession. The EU is the second largest trading bloc in the world, while the UK is the sixth largest economy. The two have been increasing their degree of commingling for over 20 years. Disentangling them is bound to create multiple disruptions that, due to the size of the parties involved, will ripple through the global economy. That means that should a hard Brexit occur, we can probably already pencil in April 12, 2019, as the starting date
The World Trade Organization is predicting lower trade growth in 2019-2020 (emphasis added):
World trade will continue to face strong headwinds in 2019 and 2020 after growing more slowly than expected in 2018 due to rising trade tensions and increased economic uncertainty. WTO economists expect merchandise trade volume growth to fall to 2.6% in 2019 — down from 3.0% in 2018. Trade growth could then rebound to 3.0% in 2020; however, this is dependent on an easing of trade tensions.
.....
The preliminary estimate of 3.0% for world trade growth in 2018 is below the WTO’s most recent forecast of 3.9% issued last September. The shortfall is mostly explained by a worse-than-expected result in the fourth quarter, when world trade as measured by the average of exports and imports declined by 0.3%. Until then, third quarter trade had been up 3.8%, in line with WTO projections.
In other words, the high degree of uncertainty regarding global trade relationships and conditions is slowing growth. Imagine that.
Oil is making a move higher:
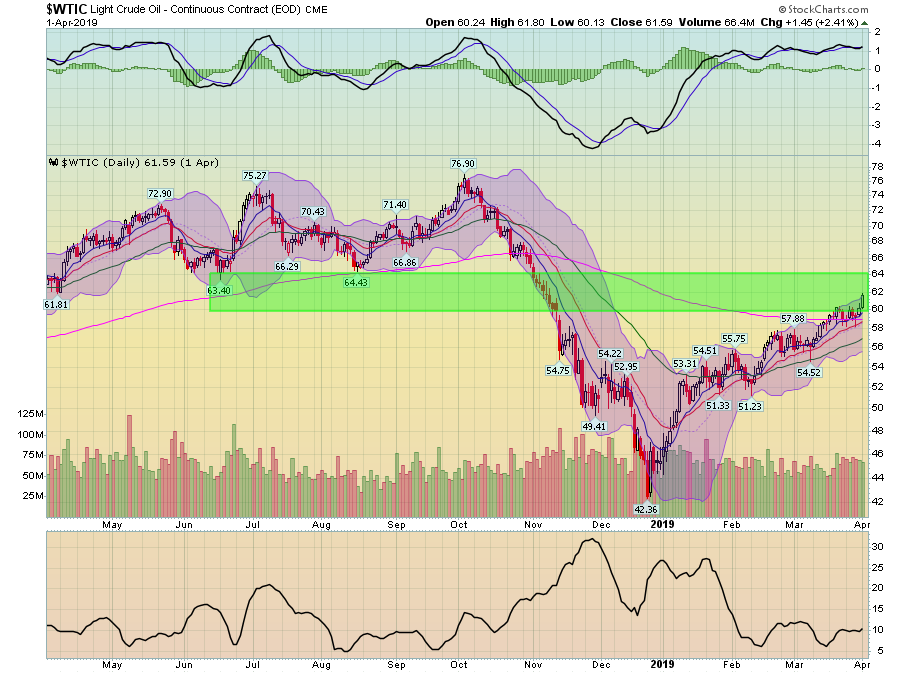
Downloaded mid-afternoon.
There is no technical resistance between current levels and the mid-60s. According to NY Fed data, this is largely a function of increased demand (emphasis added):
- Strengthening demand expectations and a higher residual offset higher anticipated supply, resulting in an increase in oil prices this week. In 2018: Q4, oil prices fell due to declining demand and increasing supply.
- Developments in global demand expectations since 2017: Q3 have reversed the largely supply-induced weakness in oil prices seen throughout the first half of 2017.
Let's turn to today's performance table:
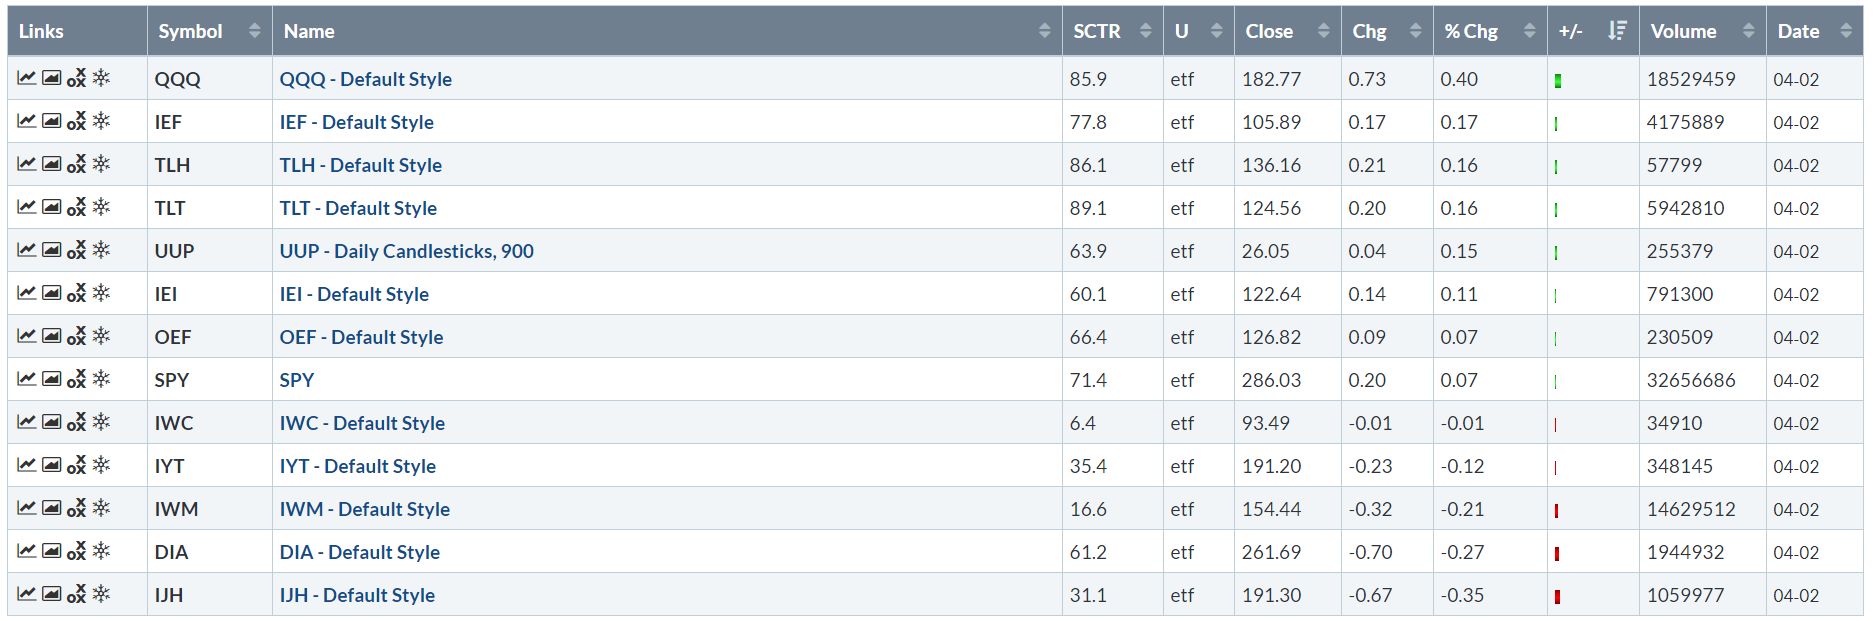
While the overall performance was muted, we can still glean key information from the table. First, we (again) have the odd situation of an equity index (QQQ) at the top of the table followed by three Treasury market ETFs. The SPYs - another large-cap index - were down marginally. The IWM and IJH were down modestly. But the key word is "down".
Simply to reiterate, the main problem with the markets right now is the conflicting signals we're getting: the bond market and small-caps are saying, "slower growth," while the large-cap stocks are saying, "strong growth". At some point, something has to give. Today, however, nothing has.
Let's start with the 5-minute charts:
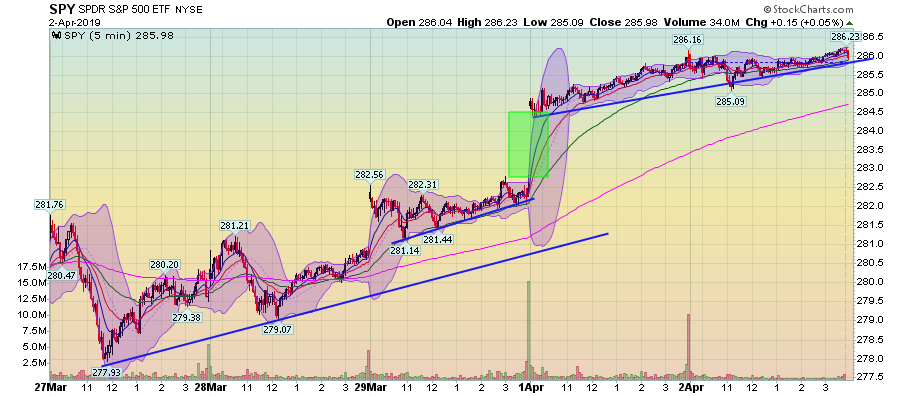
The SPY is in the middle of a nice uptrend. In fact, there's the overall trend along with three sub-trends plus a gas higher.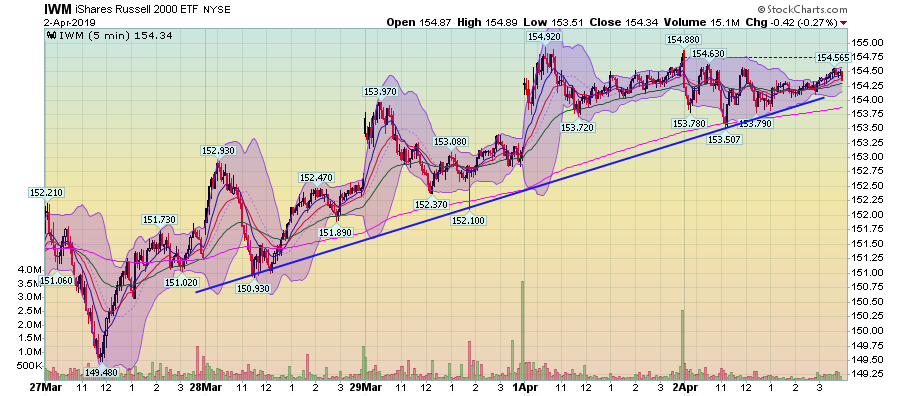
The IWM is also moving higher at a consistent pace.
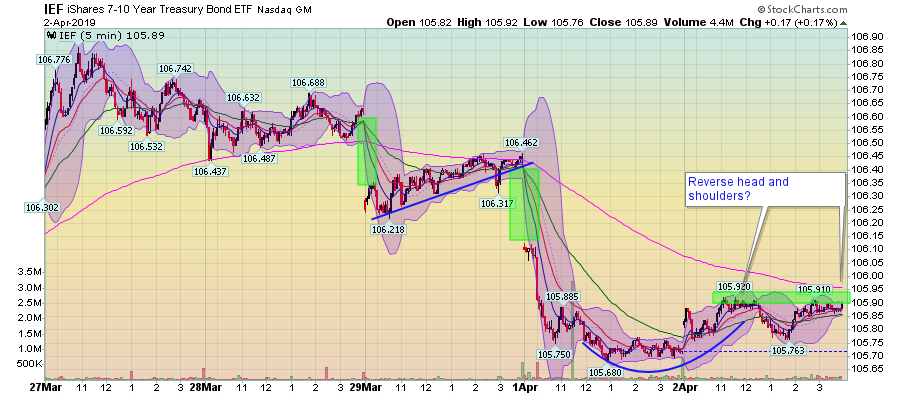
On the other hand, we have the 5-day IEF chart which is in a clear downtrend. There are two gaps lower (which are more common in the Treasury market ETFs). Over the last few days, it's possible we could be seeing a reverse head and shoulders formation.
But the 30-day charts are less than inspiring:
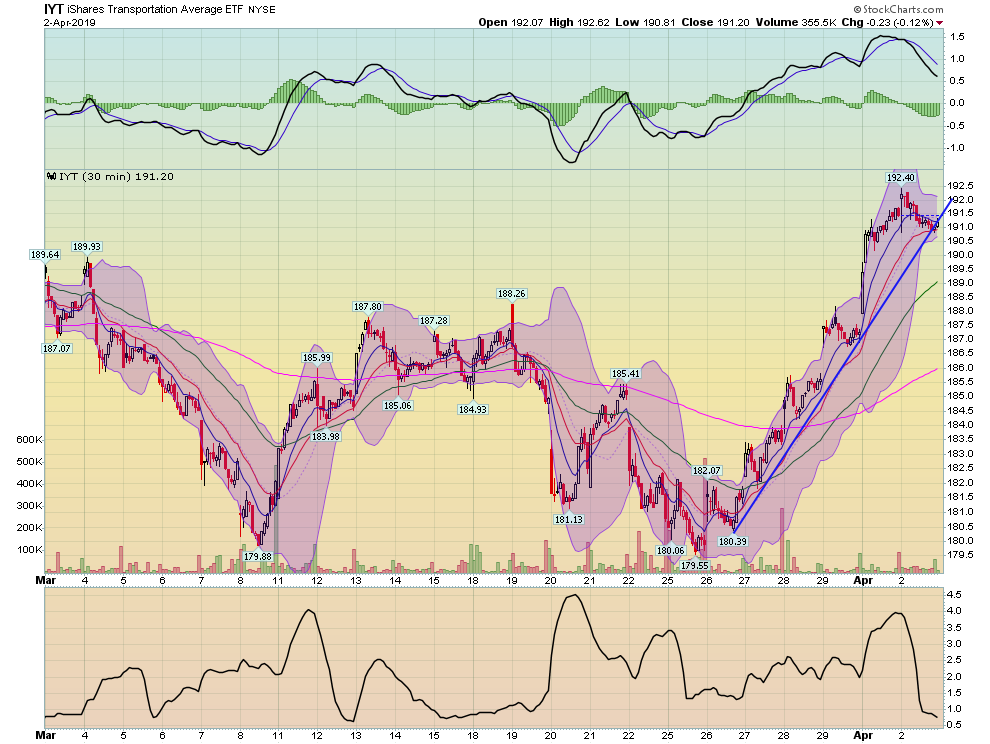
The transports are either right at trend or have broken a short-term trend line. And, its MACD has given a sell signal.
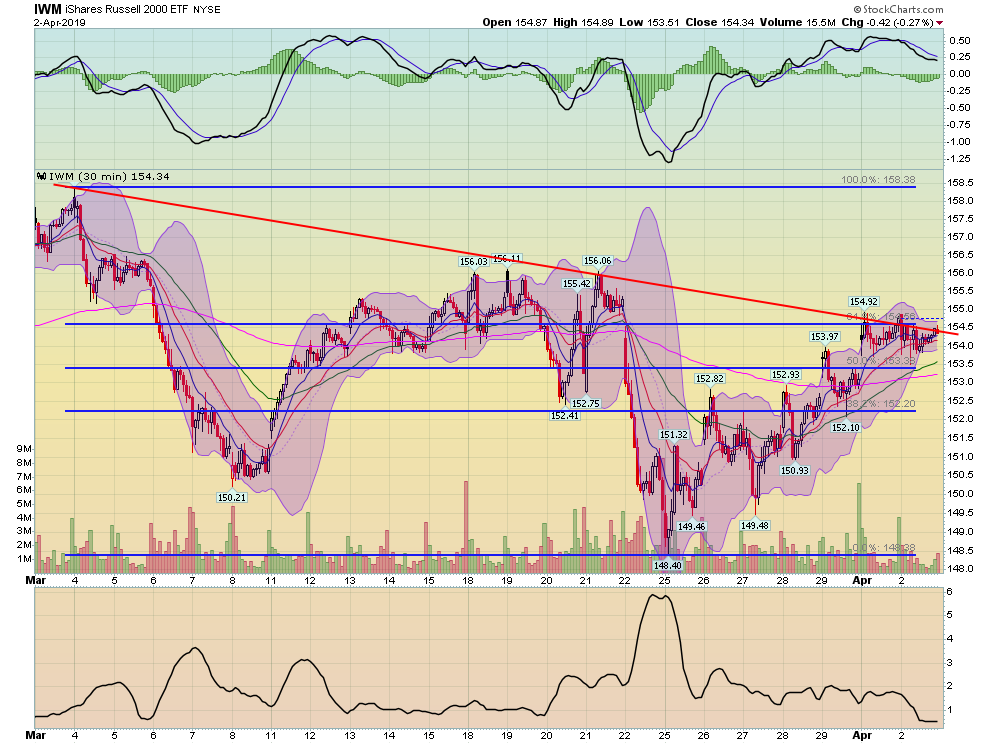
The IWMs are still in the lower half of their 30-day range. And it's also constrained by the trend line connecting recent highs while also having a declining MACD.
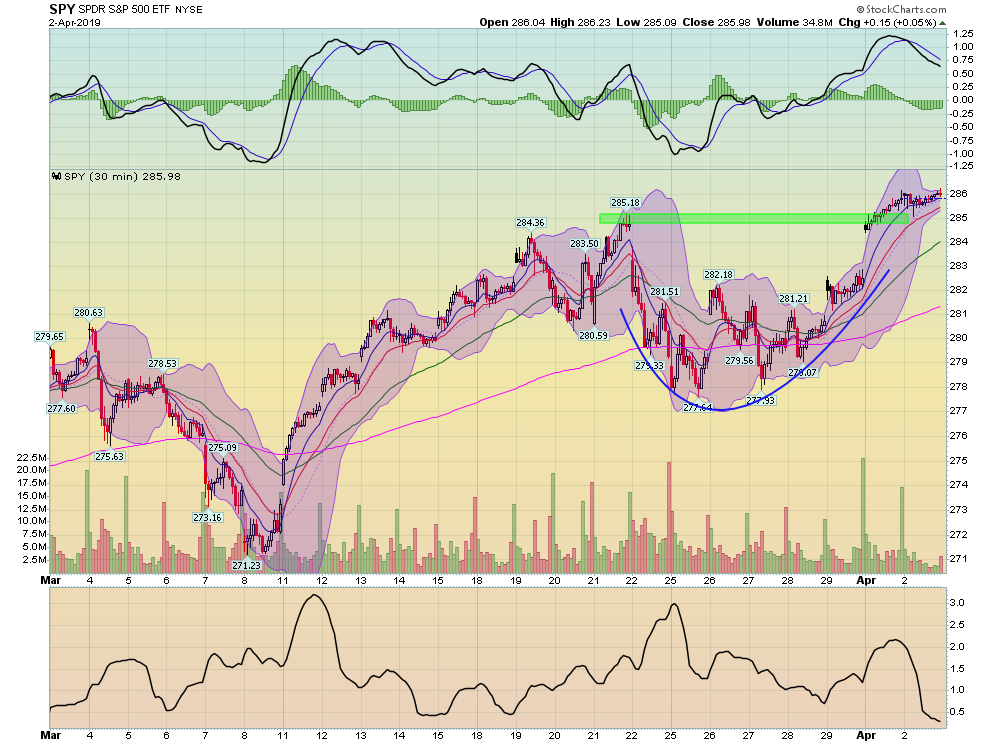
While it's near a 30-day high, the SPYs MACD has also given a sell signal.
And then we have these daily charts:
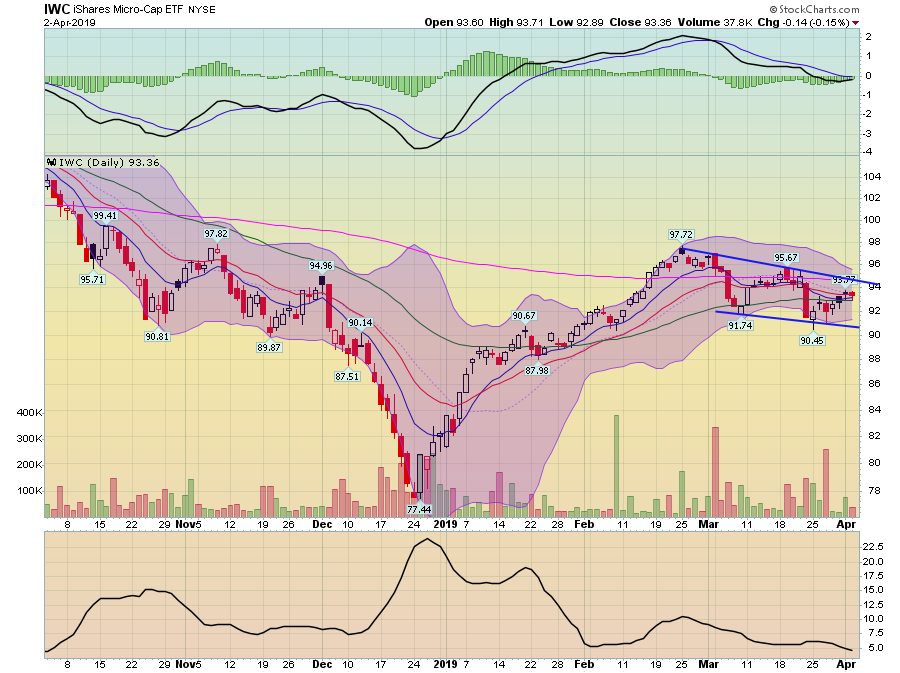
Micro-caps are still in a clear downward trend.
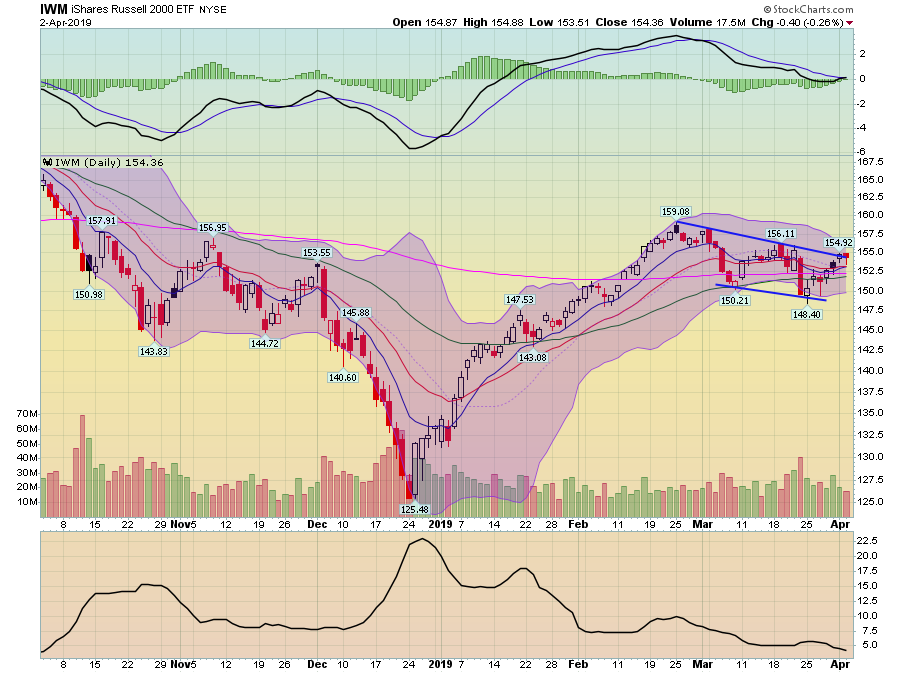
As are small-caps.

While mid-caps have broken out, they haven't done so in a strong way. Right now, they're sitting right above their latest trendline.
The lack of meaningful upward participation from the micro, small, and mid-cap indexes continue to be a big problem for this rally. I'd feel a lot more comfortable with this uptrend if these riskier averages not only broke out but moved above recent highs.
Disclosure: I/we have no positions in any stocks mentioned, and no plans to initiate any positions within the next 72 hours. I wrote this article myself, and it expresses my own opinions. I am not receiving compensation for it (other than from Seeking Alpha). I have no business relationship with any company whose stock is mentioned in this article.