
European Session
EUR/USD
 EUR/USD Daily Chart" title="EUR/USD Daily Chart" width="474" height="242">
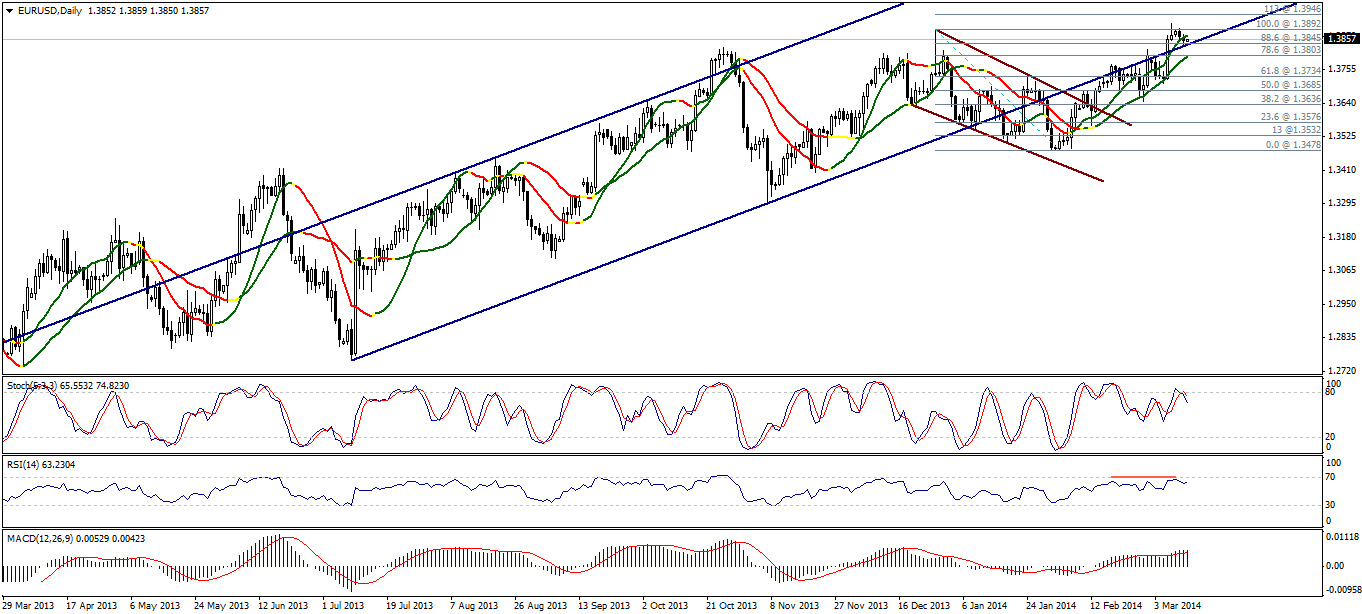
The downside attempts for the pair remained limited above the medium term ascending channel support as shown over daily basis. Stability above 1.3810 will keep the upside move valid while stability above 88.6% at 1.3845 will further support the upside move.
Momentum indicators are biased negatively and accordingly a breach of 1.3895 is required to negate bearish pressure. To the downside, a breakout below 1.3770 will weaken the upside move.
 EUR/USD S&R Chart" title="EUR/USD S&R Chart" width="474" height="242">
GBP/USD
 GBP/USD Daily Chart" title="GBP/USD Daily Chart" width="474" height="242">
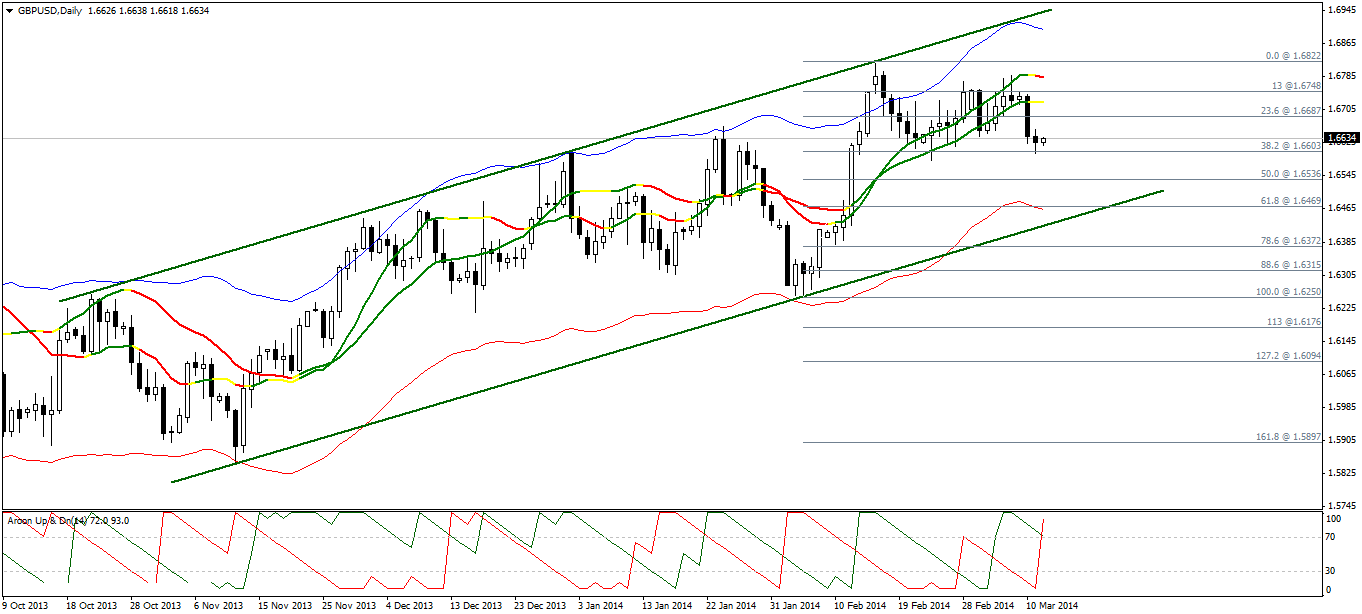
The downside attempting remained limited yesterday for sterling above 1.6600, near 38.2% correction shown on graph. Without a breakout below this level we cannot confirm the downside move.
At the same time, the current upside move requires the return above 1.6670 followed by stability above 1.6700 to negative the negativity on AROON. Therefore, we prefer to remain neutral today taking into account that exiting the trading range between 1.6600 and 1.6670 is required to favor the latter.
 GBP/USD S&R Chart" title="GBP/USD S&R Chart" width="474" height="242">
USD/JPY
 USD/JPY Daily Chart" title="USD/JPY Daily Chart" width="474" height="242">
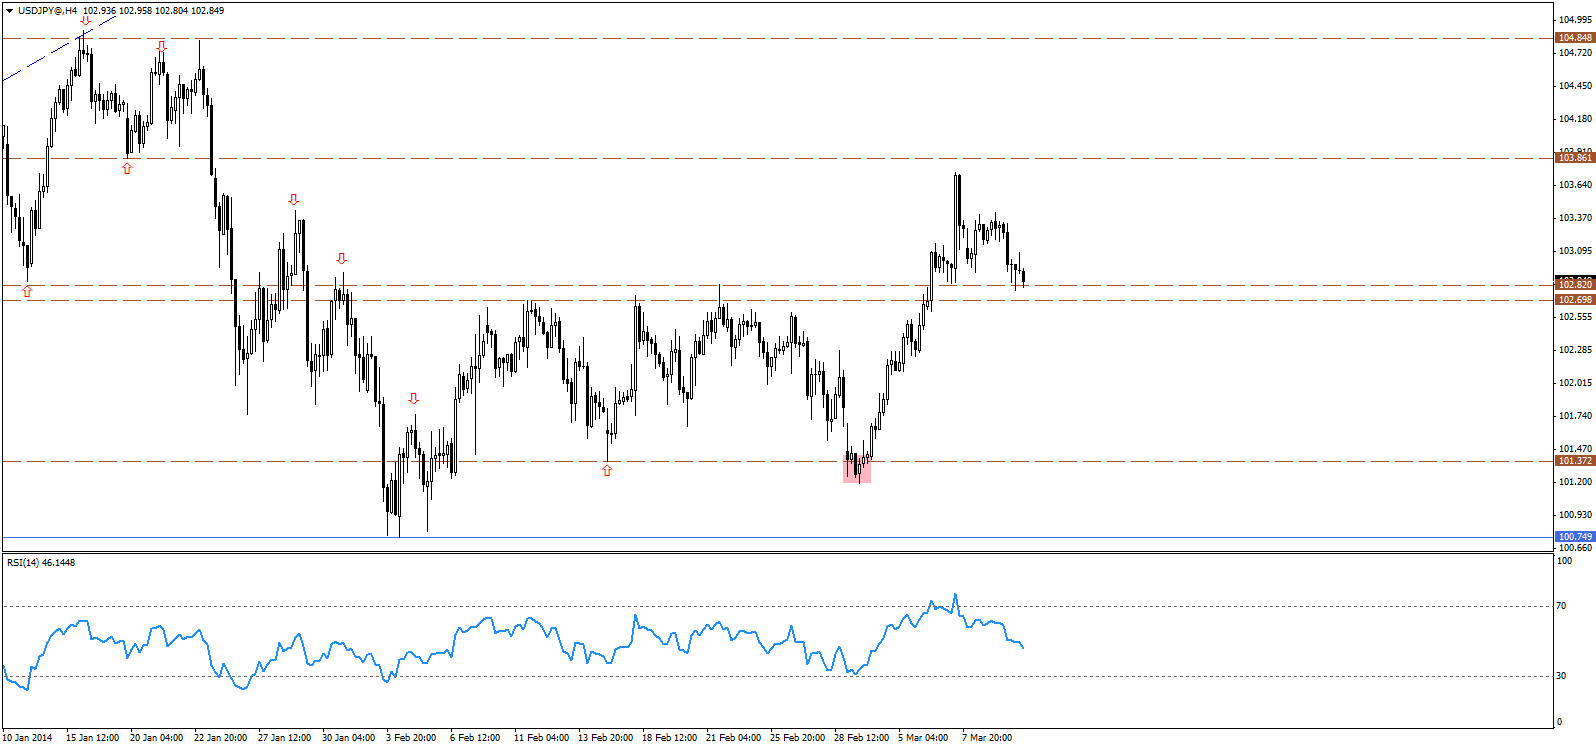
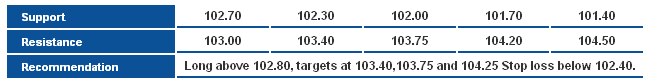
The USD/JPY extends the downside pullback towards the broken main resistance area around 102.70, where we expect the bullish bias to resume from that support, in an attempt to resume the bullish breakout, targeting mainly 103.80 and 104.40 levels. Note that the bullish scenario may weaken on a break back below that support at 102.70.
 USD/JPY S&P Chart" title="USD/JPY S&P Chart" width="474" height="242">
USD/CHF
 USD/CHF Daily Chart" title="USD/CHF Daily Chart" width="474" height="242">
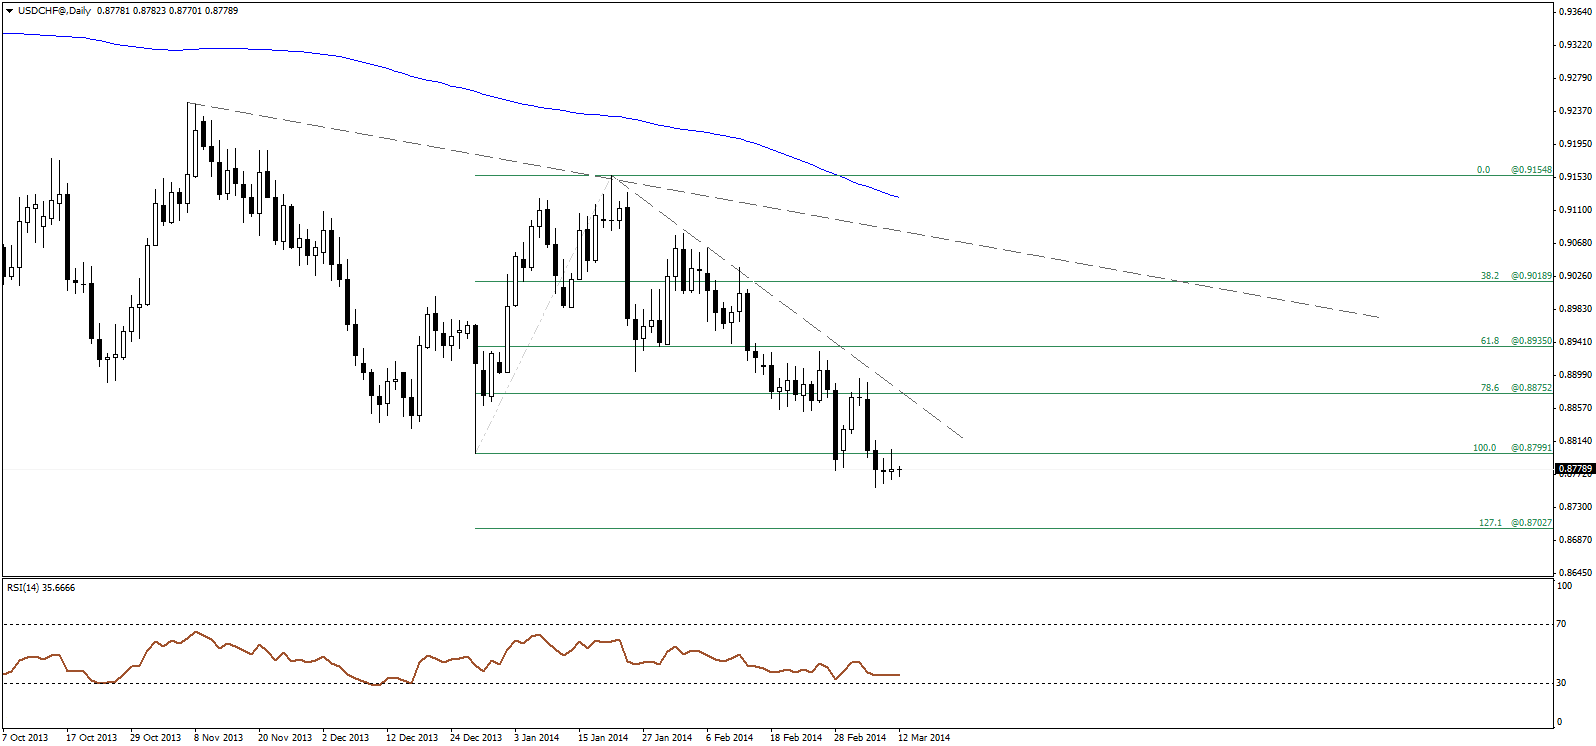
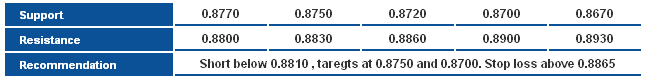
The USD/CHF remains under pressure consolidating below the broken support level at 0.8800, where upside pullbacks yesterday were shallow and limited to 0.8800 level. Holding below 0.8800 over intraday basis keeps the bearish bias favored, while over the near term 0.8860 resistance should hold for the bearish bias to remain dominant, targeting the 127.1 extension level at 0.8700.
 USD/CHF S&R Chart" title="USD/CHF S&R Chart" width="474" height="242">
USD/CAD
 USD/CAD" title="USD/CAD" height="242" width="474">
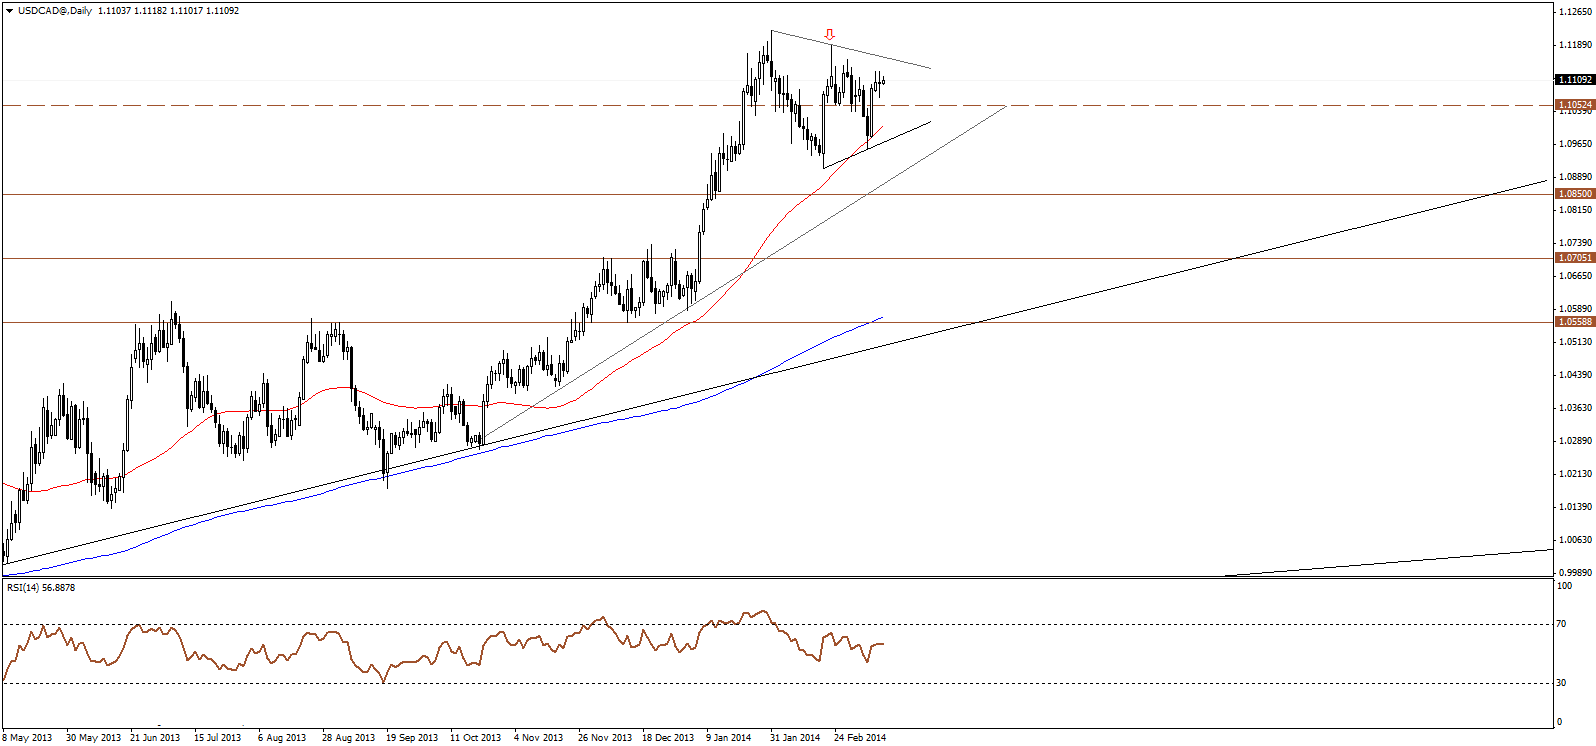
The USD/CAD fluctuated yesterday, as price formed a long legged doji hinting in indecision, meantime price remains above 1.1050 broken-resistance-turned-support, and thus we maintain our bullish bias eying a retest of the descending resistance for the potential symmetrical triangle shown on the daily chart above.

AUD/USD
 AUD/USD Daily Chart" title="AUD/USD Daily Chart" width="474" height="242">
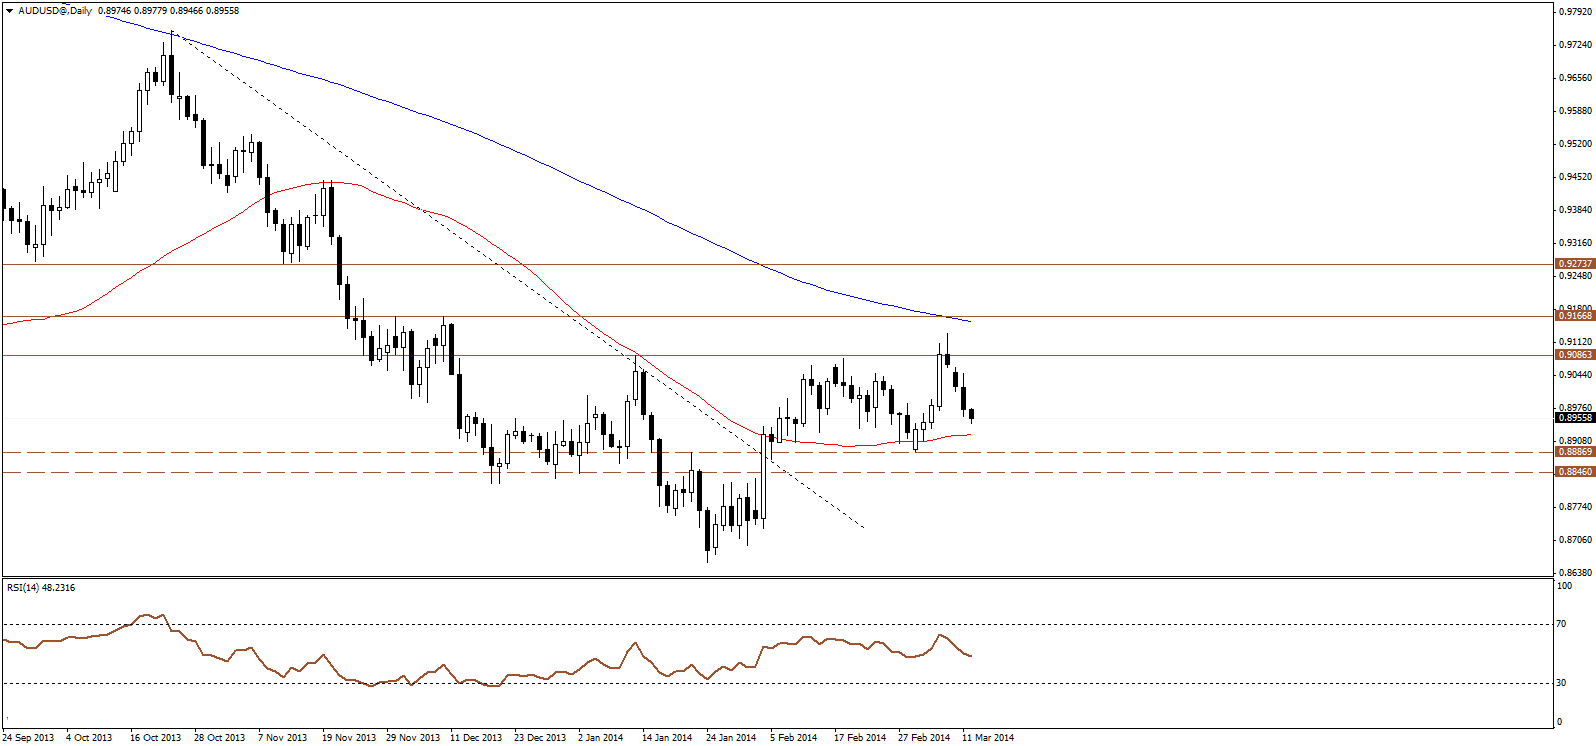
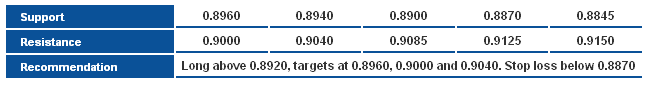
The AUD/USD extended the retreat, after failing at the main resistance area around 0.9085 and the 200-days SMA, where price is approaching the 50-days SMA and key short term support level at 0.8900 areas. We expect price to find support around that area for a possible new bullish attempt, as the recent bullish wave that started from 0.8660 low is still intact. Note that a break below that latter support area would threaten for the resumption of the overall bearish trend.
 AUD/USD S&R Chart" title="AUD/USD S&R Chart" width="474" height="242">
NZD/USD
 NZD/USD Hourly Chart" title="NZD/USD Hourly Chart" width="474" height="242">
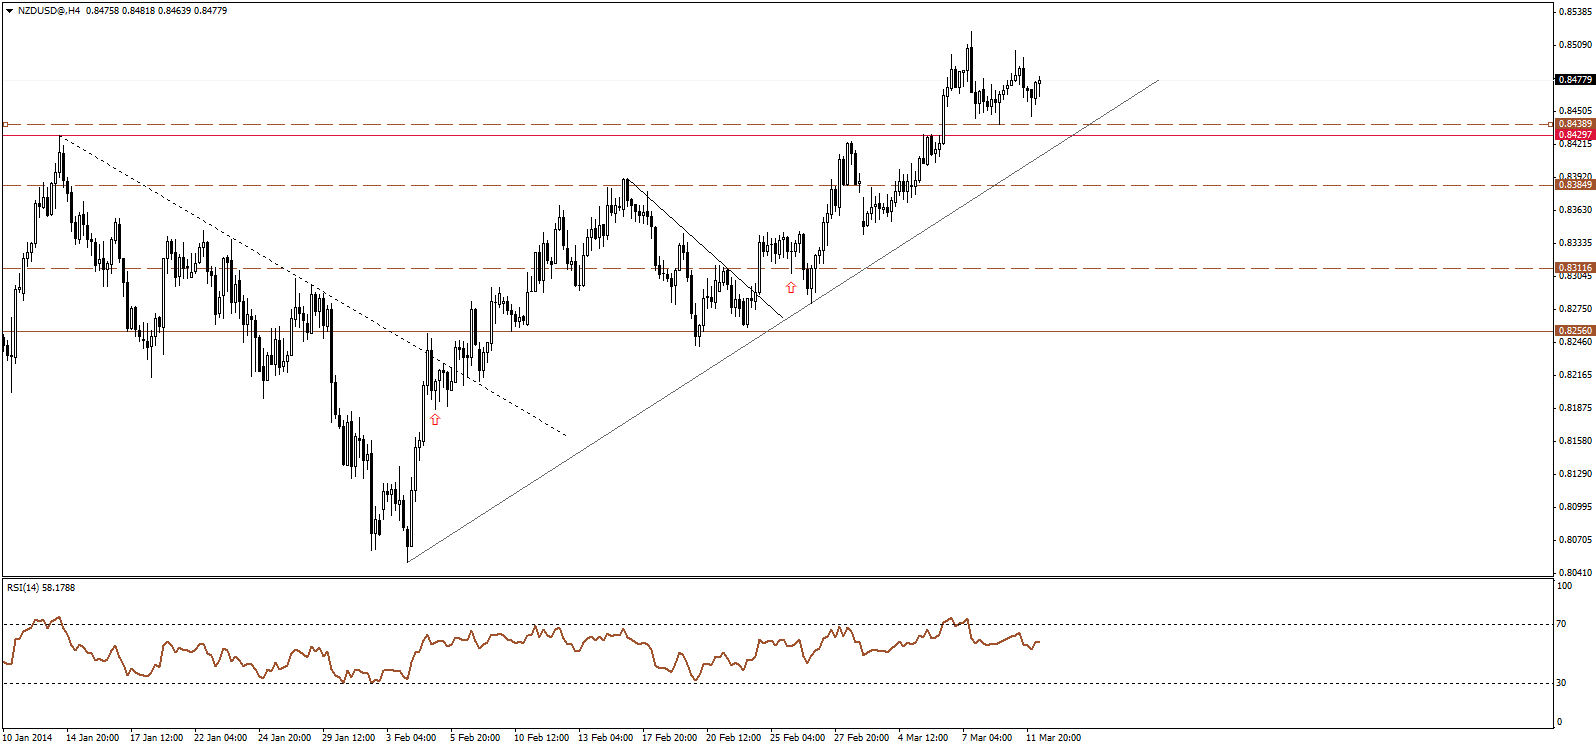
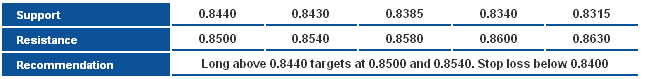
The NZD/USD is fluctuating in a sideways bias above the key support area among 0.8440-0.8430, and that keeps the overall bullish bias intact and valid, as we expect price to retest the recent high at 0.8520 and 0.8550 next main resistance level. Holding above 0.8400 is necessary for this scenario to remain valid.
 NZD/USD S&R Chart" title="NZD/USD S&R Chart" width="474" height="242">