
European Session
EUR/USD
 EUR/USD Daily Chart" title="EUR/USD Daily Chart" width="474" height="242">
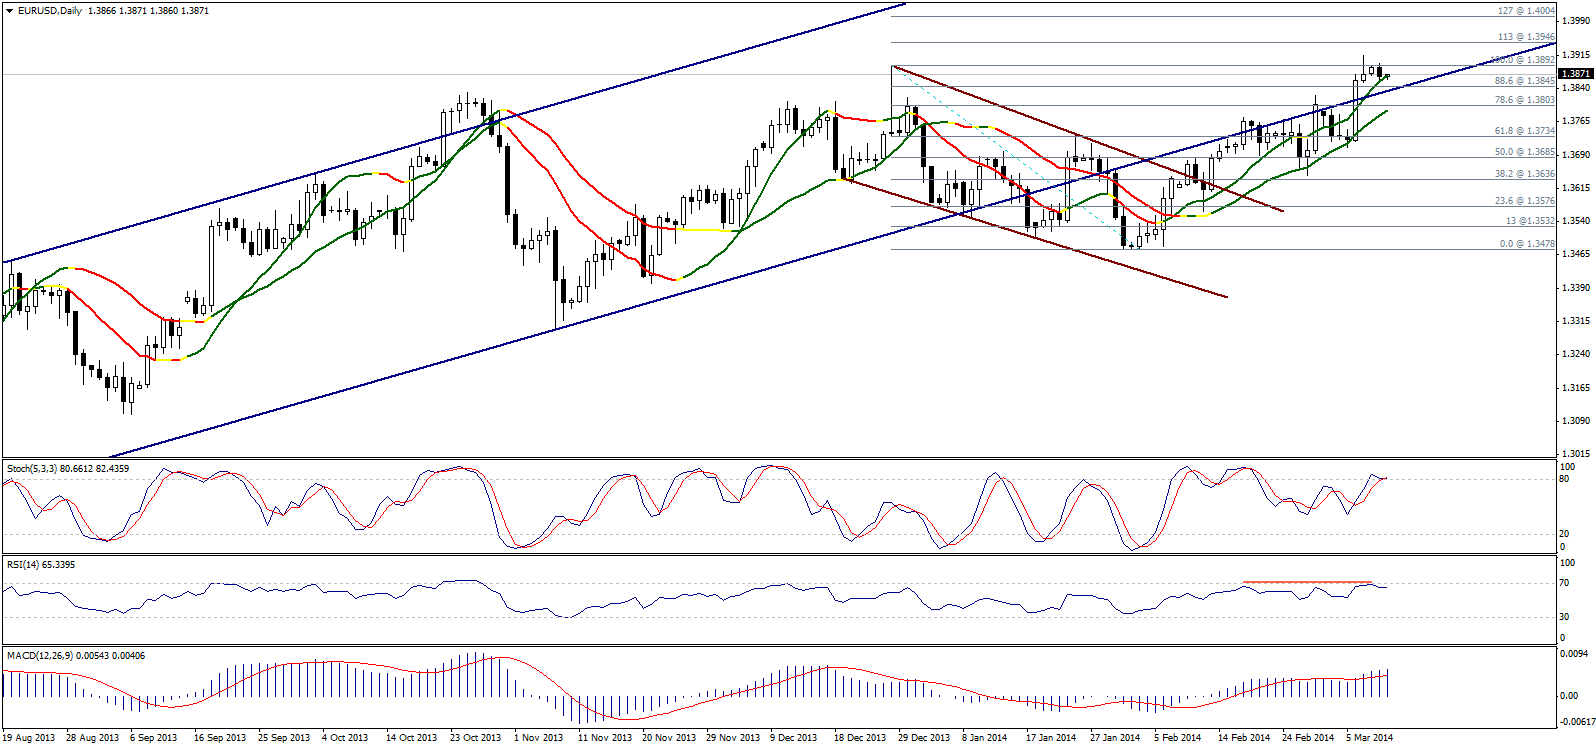
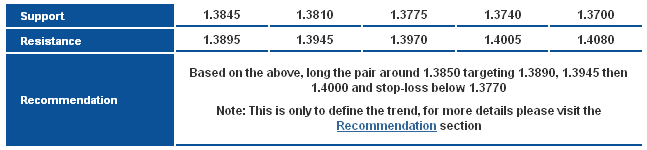
The pair dropped yesterday but remained limited above 1.3845 support. Stability above this level keeps chances for the upside move valid, while a breach of 1.3895 supports our expectations.
We need to see the pair consolidate above 1.3895 to offset the negativity on RSI and Stochastic, but the positive outlook for now depends on trading within the medium-term ascending channel alongside positivity on Linear Regression Indicators 34 & 55.
 EUR/USD S&R Chart" title="EUR/USD S&R Chart" width="474" height="242">
GBP/USD
 GBP/USD Daily Chart" title="GBP/USD Daily Chart" width="474" height="242">
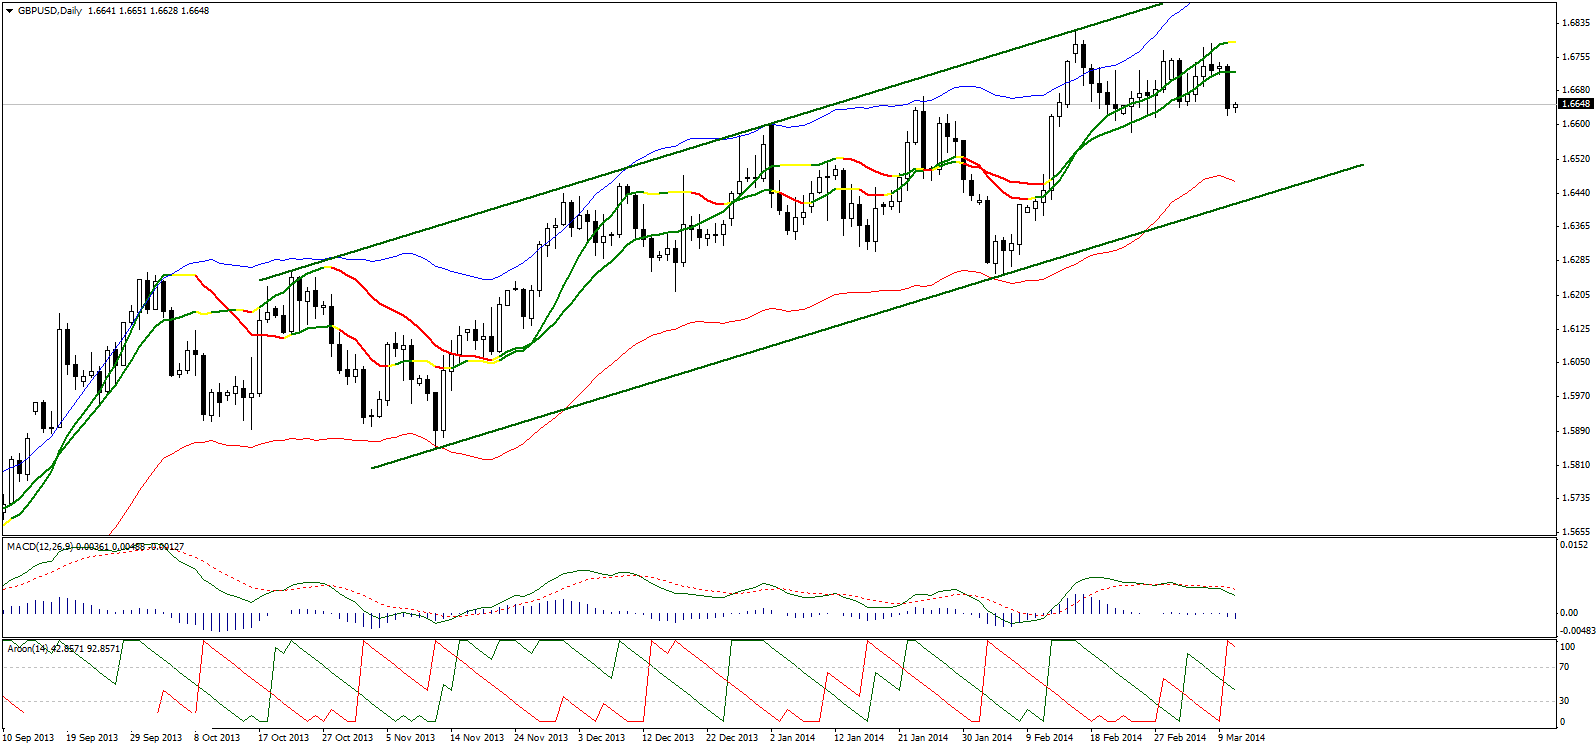
The sharp downside move seen yesterday triggered negative signals on AROOM where the downside move is in response to downside signals on MACD. The downside move pushed the pair below Linear Regression Indicator 55 by forming a long bearish candle in which the pair provided a breakout below 1.6670.
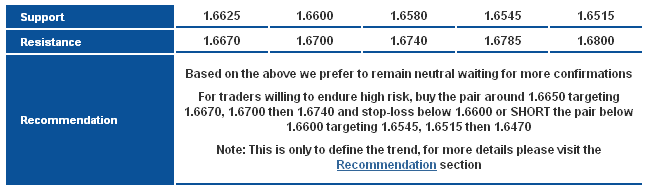
Stability below 1.6670 might put more downside pressure on the pair, but at the same time, we need to see a breakout below 1.6600 to confirm the extension of the downside move. The upside move today requires returning above 1.6740 and we do not have clear intraday signals to pinpoint the next move and accordingly we remain neutral.
 GBP/USD S&R Chart" title="GBP/USD S&R Chart" width="474" height="242">
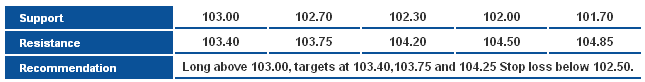
USD/JPY
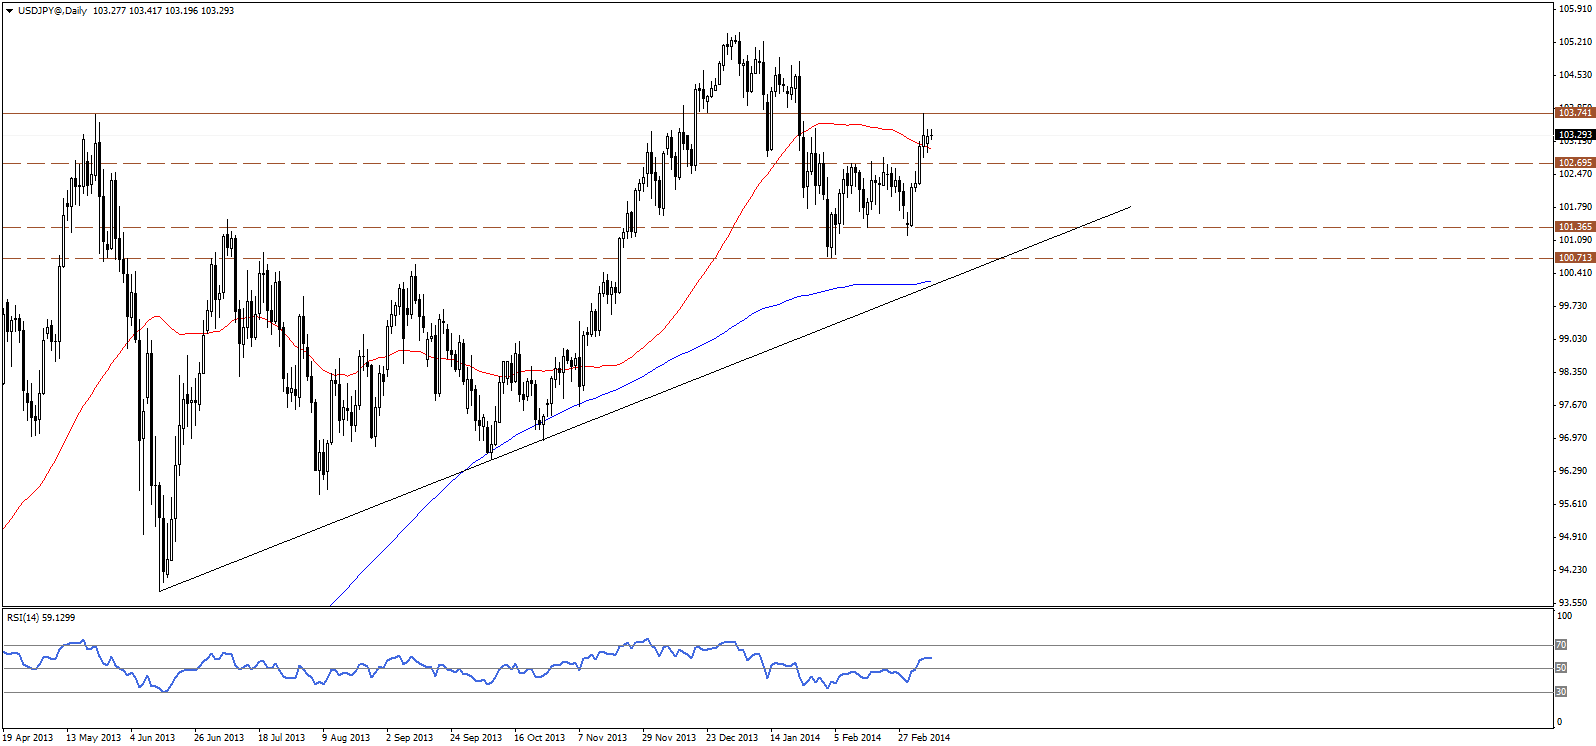 USD/JPY Daily Chart" title="USD/JPY Daily Chart" width="474" height="242">
The USD/JPY retreats back lower after retesting 103.75 resistance level, the price is currently hovering above the 50-days SMA, meantime, it’s holding above 102.70 broken-resistance level which should hold for the bullish breakout to remain valid. Accordingly, the bullish scenario remains favored for today, targeting a retest of 103.75 resistance level, and probably higher. A break with stability back below 102.70 may threaten for a new bearish wave.
 USD/JPY S&R Chart" title="USD/JPY S&R Chart" width="474" height="242">
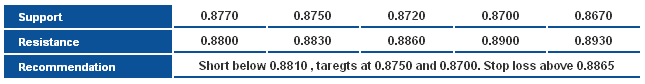
USD/CHF
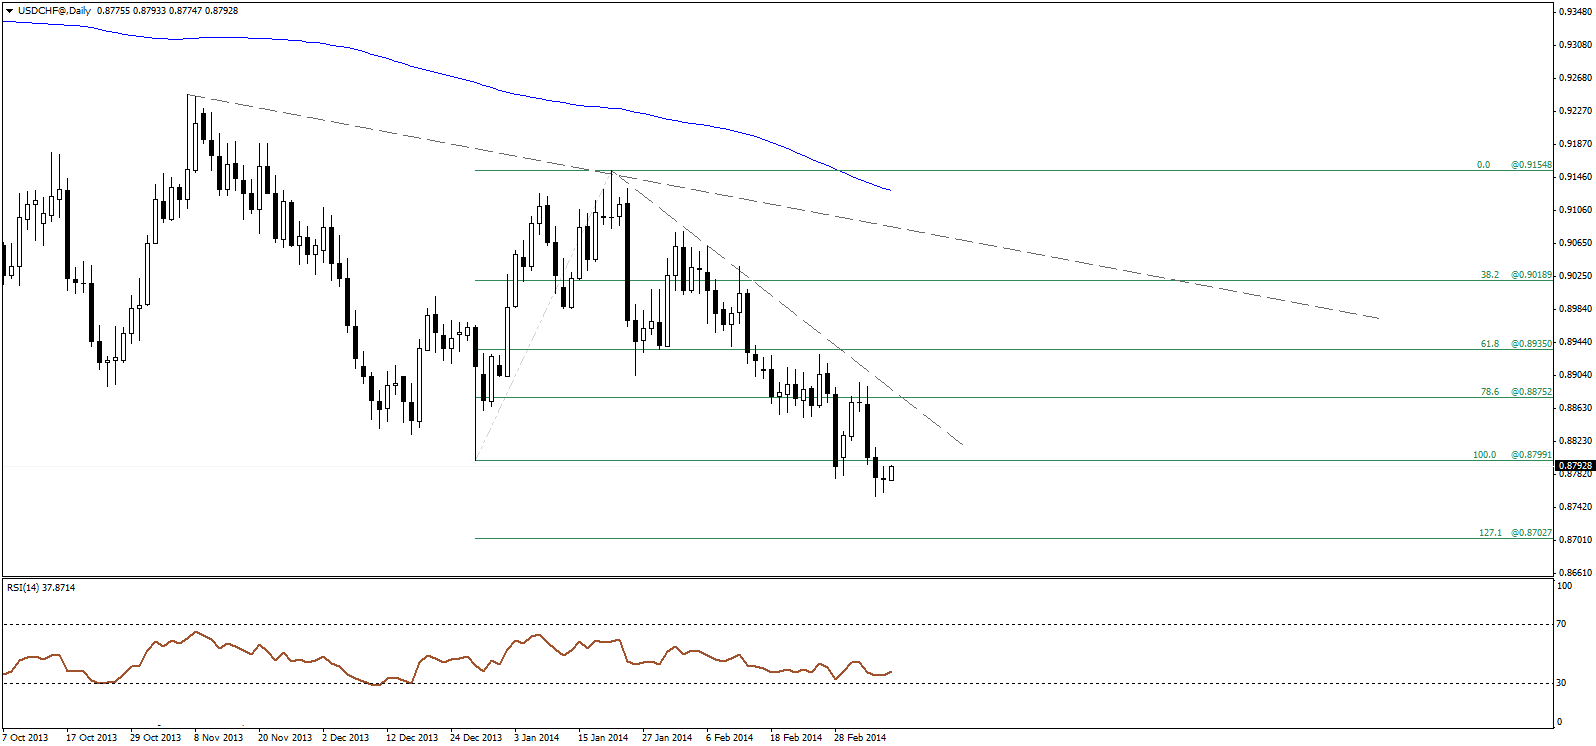 USD/CHF Daily Chart" title="USD/CHF Daily Chart" width="474" height="242">
The USD/CHF retraces slightly higher but remains below the major swing low at 0.8815 intraday resistance, and that keeps the bearish bias intact and hints the pair is probably heading lower, for a test of the 127.1 extension level for the latest main bullish correction, which resides around 0.8700 level. Meantime, the overall bearish scenario remains valid so long as below 0.8860 for today.
 USD/CHF S&R Chart" title="USD/CHF S&R Chart" width="474" height="242">
USD/CAD
 USD/CAD Daily Chart" title="USD/CAD Daily Chart" width="474" height="242">
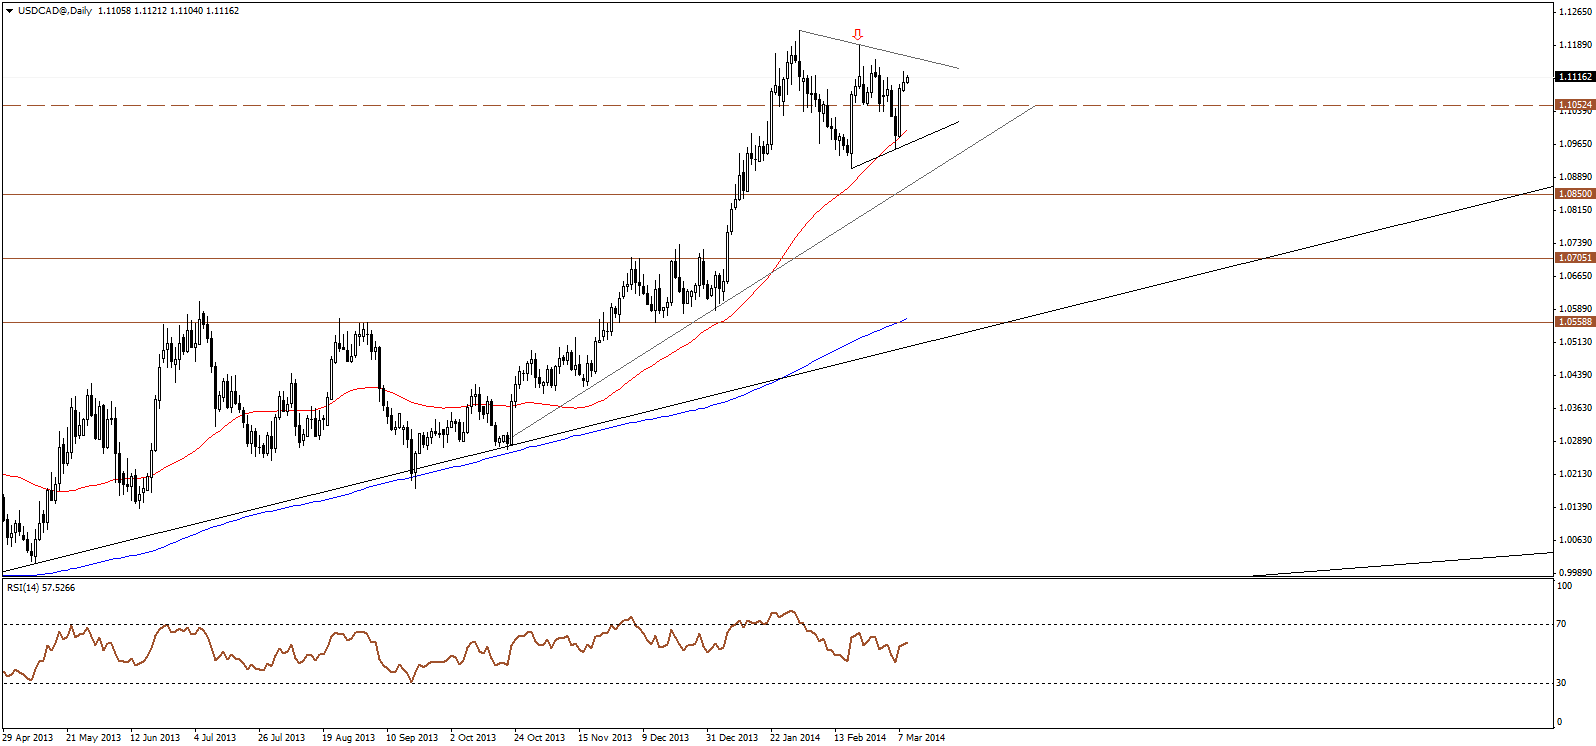
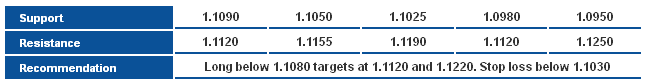
The USD/CAD rebounded of the 50-days SMA to break and settle back above 1.1050 resistance level, and that hints further upside is likely towards the minor descending resistance for the recent sideways correction as shown on the daily chart above. A break above the latest major high around 1.1220 remains necessary to confirm the continuation of the overall bull trend.
 USD/CAD S&R Chart" title="USD/CAD S&R Chart" width="474" height="242">
AUD/USD
 AUD/USD Daily Chart" title="AUD/USD Daily Chart" width="474" height="242">
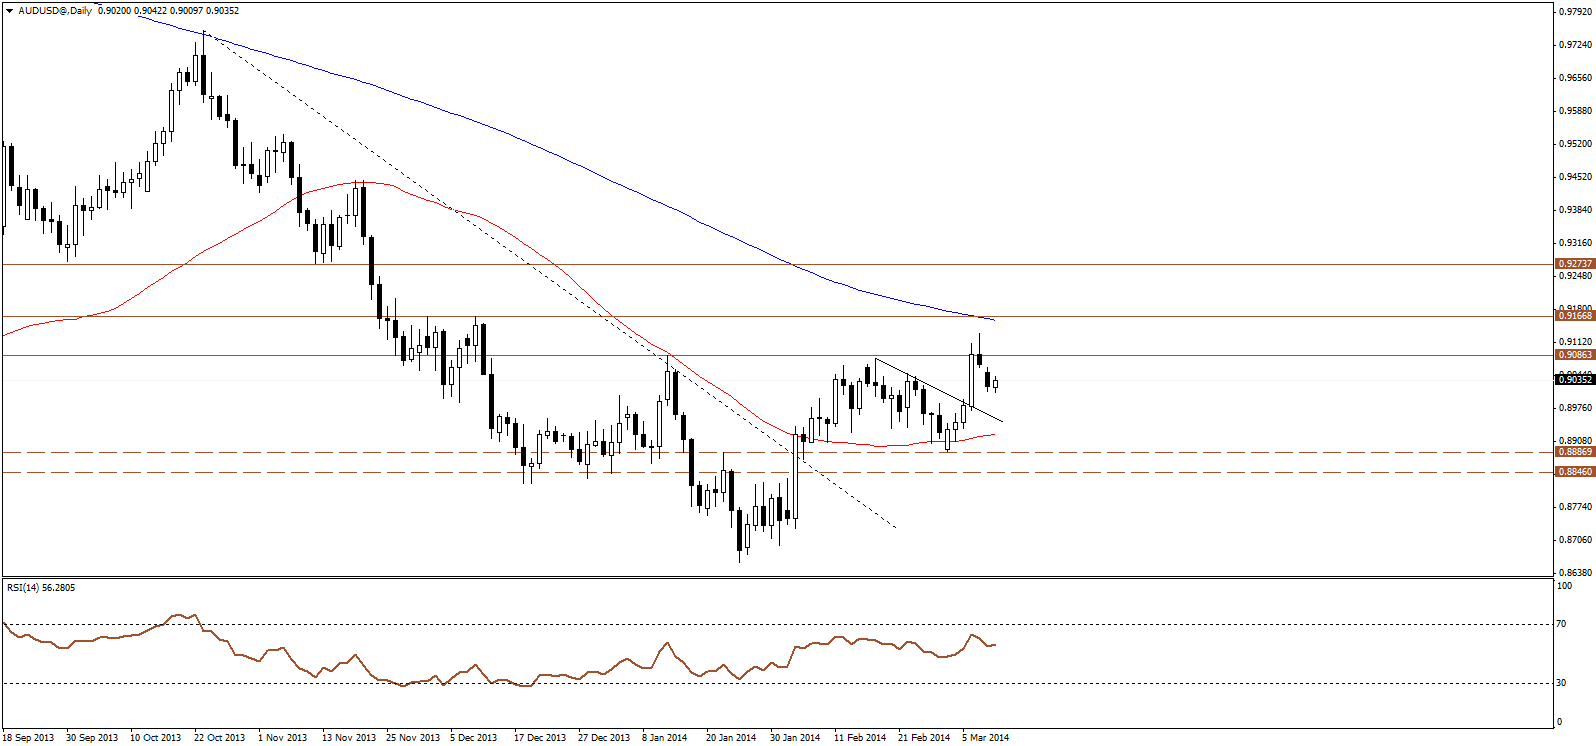
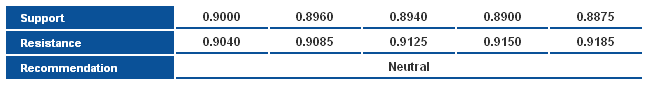
The AUD/USD retreats after hitting 0.9085 resistance level, as price formed a shooting star bearish candle on Friday, and thus hinted a potential setback, which materialized yesterday as price extended the downside, however for now, there is a potential for resuming the bullish trend that started from 0.8660 low and accordingly we prefer to wait for a confirmation for the next move. .A break with stability above 0.9100 may confirm a more prolonged bullish rebound.
 AUD/USD S&R Chart" title="AUD/USD S&R Chart" width="474" height="242">
NZD/USD
 NZD/USD Daily Chart" title="NZD/USD Daily Chart" width="474" height="242">
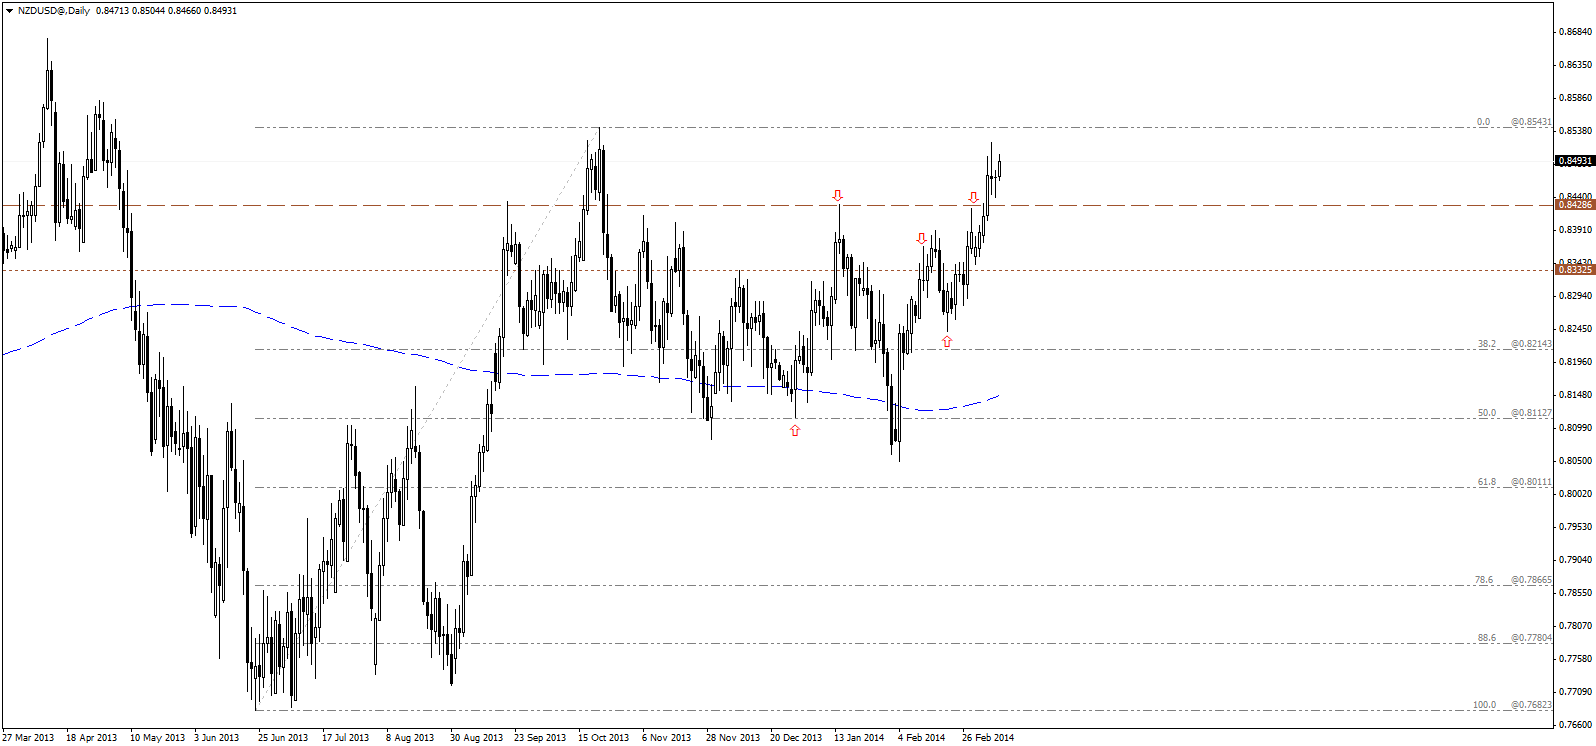
The NZD/USD was rejected on Friday, near the main resistance level at 0.8540, as price formed a long legged doji candle, hinting a potential pullback, which pushed price lower yesterday but again found renewed bullish pressures just above the broken resistance 0.8430, and pushing towards the latest highs. Accordingly, the strong bullish momentum continues to be dominant.
 NZD/USD S&R Chart" title="NZD/USD S&R Chart" width="474" height="242">
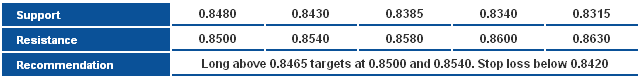