
 EUR/USD Daily Chart" title="EUR/USD Daily Chart" width="474" height="242">
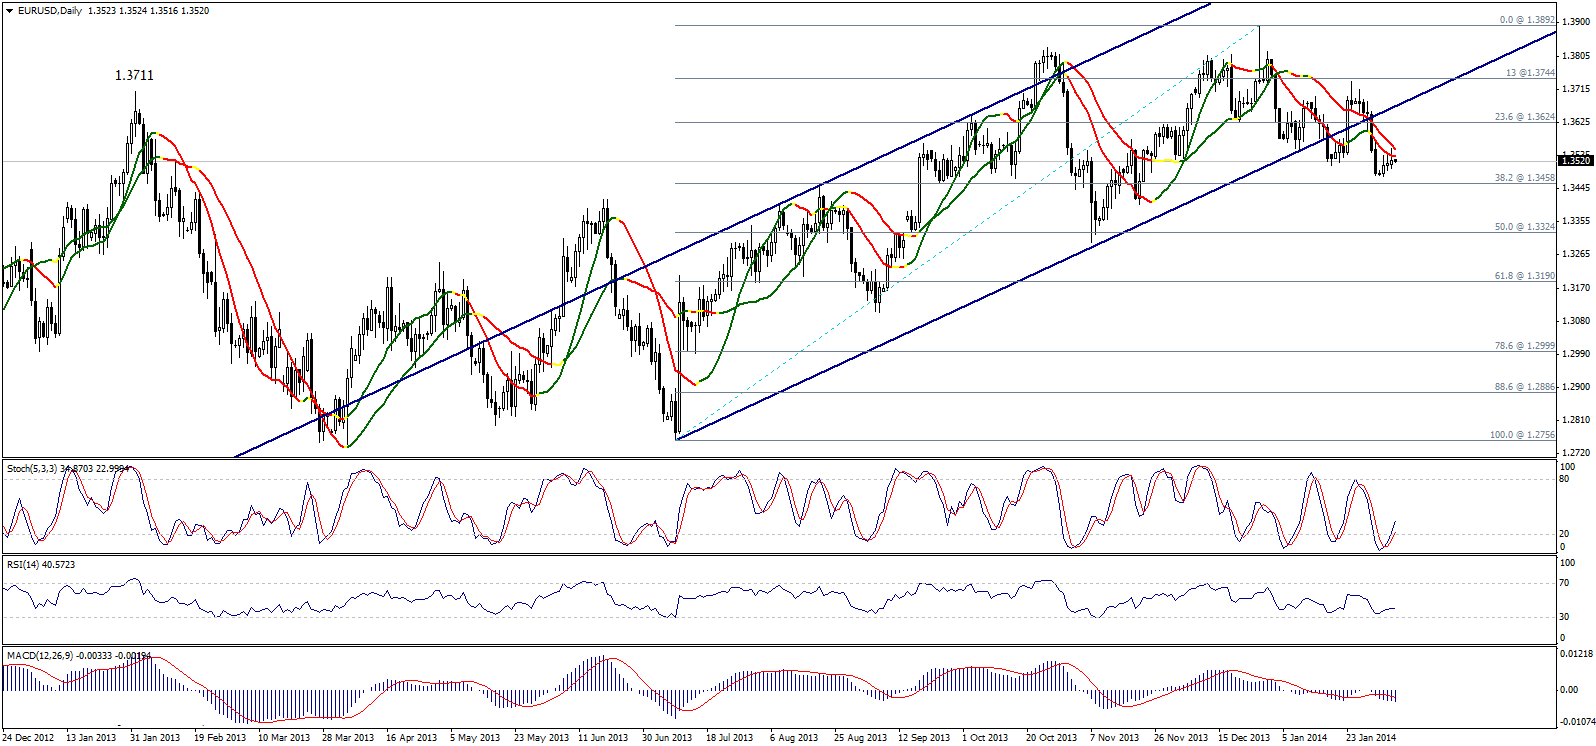
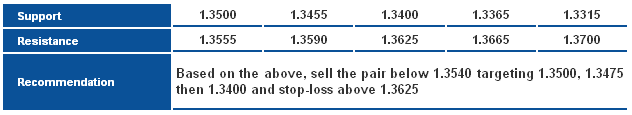
The pair is trading within a tight and volatile yesterday and attempted to move to the upside but remained limited below Linear Regression Indicators. Breaching the ascending channel still affects the pair and the bearish bias remains valid. Breaking 1.3455 is required to support the negative outlook, but we will depend on stabilizing below 1.3625 over intraday basis to keep the negative expectations.
 EUR/USD S&R Chart" title="EUR/USD S&R Chart" width="474" height="242">
 GBP/USD Daily Chart" title="GBP/USD Daily Chart" width="474" height="242">
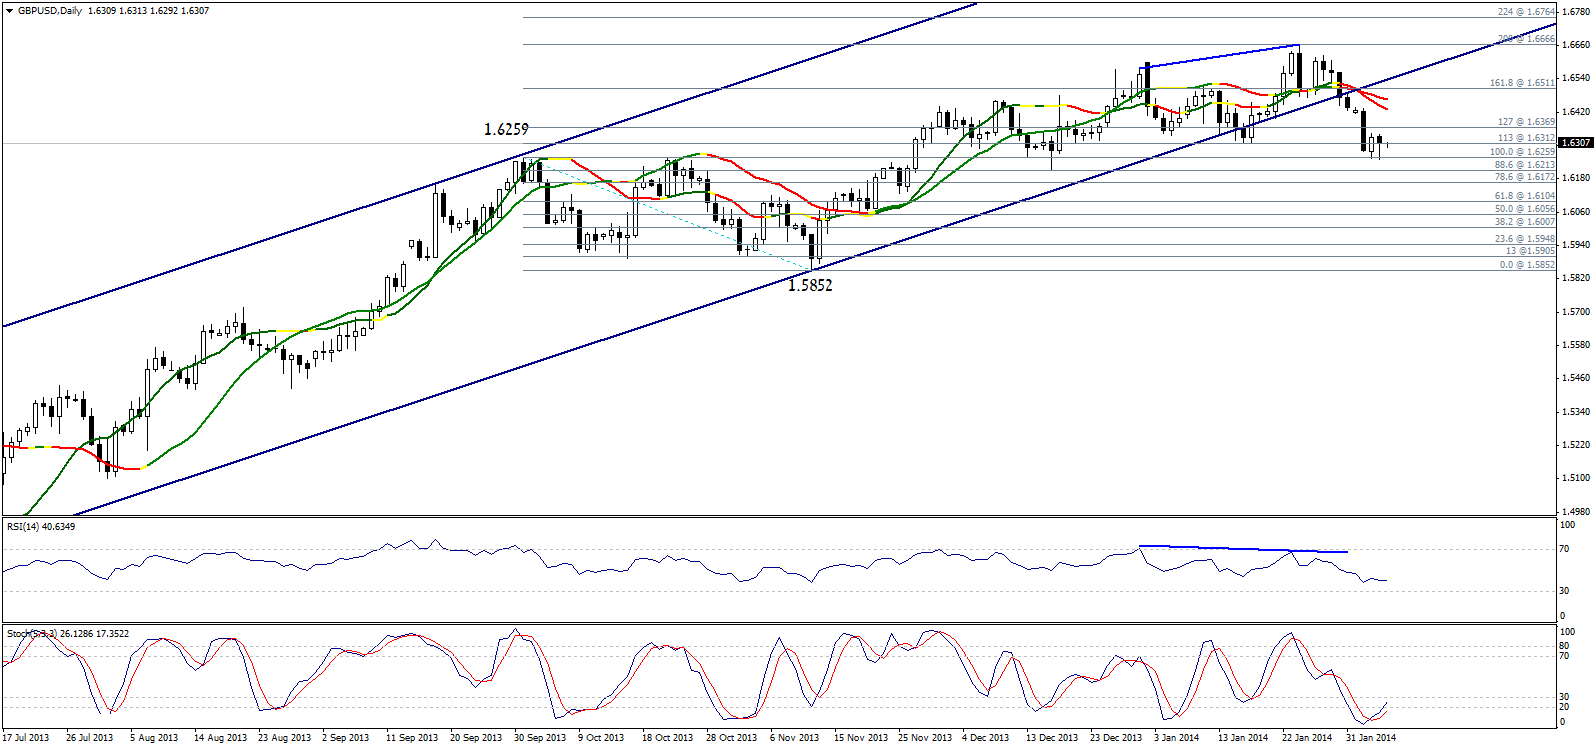
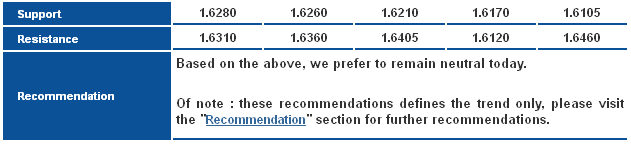
The pair managed to move to the downside yesterday, but levels around the previous top 1.6259 halted bearishness and is trading again above 1.6300. RSI and Linear Regression Indicators are negative. Stochastic is showing a bullish attempt forcing us to remain neutral today in regards to our intraday expectations.
On the long-term, trading below 1.6515 is negative and will extend the downside move; but over intraday basis we prefer to remain on the sidelines because Risk/Rewards ratios are inappropriate.
 GBP/USD S&R Chart" title="GBP/USD S&R Chart" width="474" height="242">
 USD/JPY Daily Chart" title="USD/JPY Daily Chart" width="474" height="242">
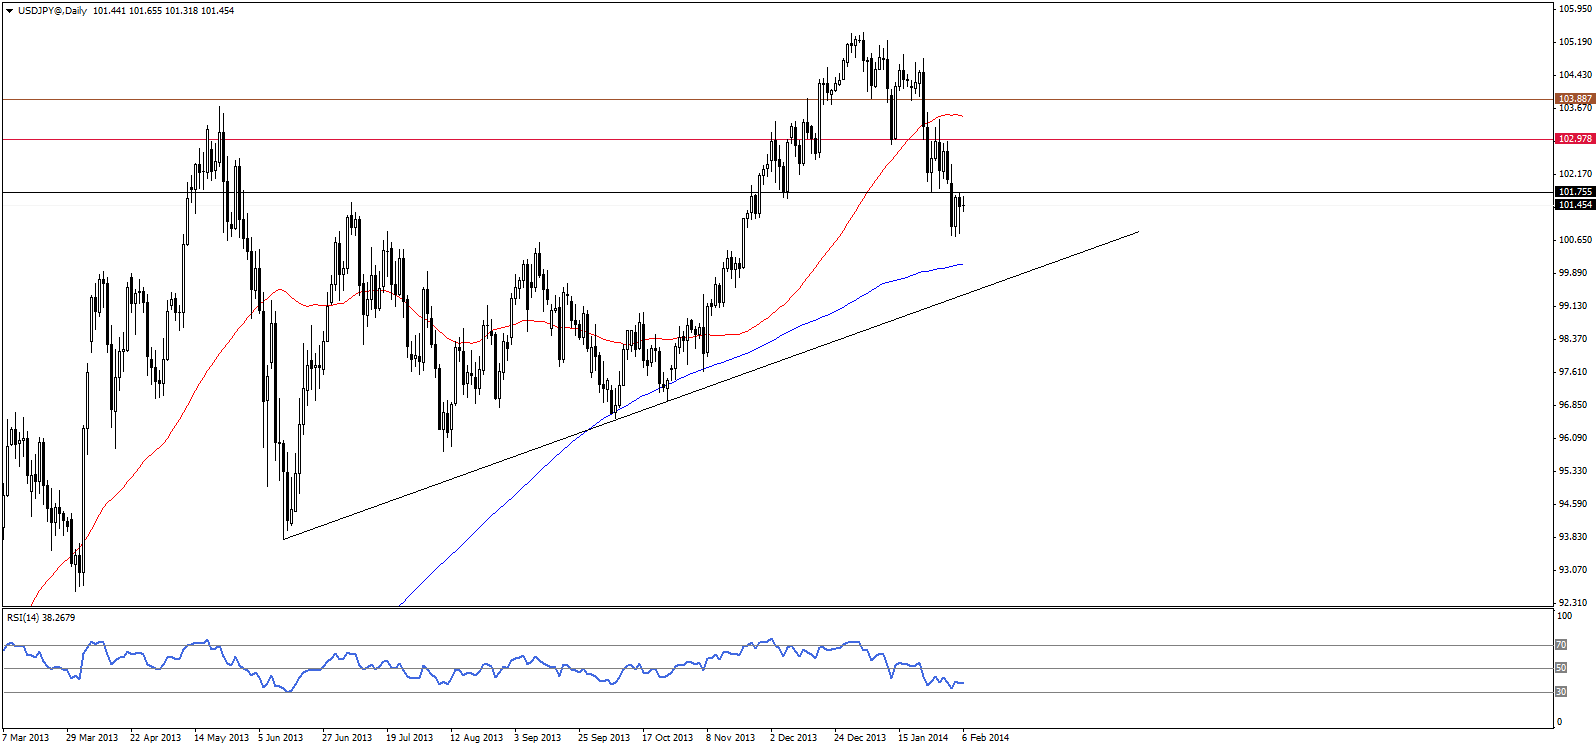
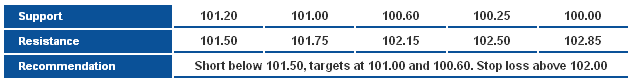
The USD/JPY fluctuated yesterday, but remains below the recent key intraday resistance at 101.75, and that keeps the bearish scenario intact. We continue to expect further downside so long as the 101.75 is resistance, targeting 101.00,100.60 and the 200-days SMA. Alternatively, we will look for a bullish rebound on a break above that resistance.
 USD/JPY S&R Chart" title="USD/JPY S&R Chart" width="474" height="242">
 USD/CHF Hour Chart" title="USD/CHF Hour Chart" width="474" height="242">
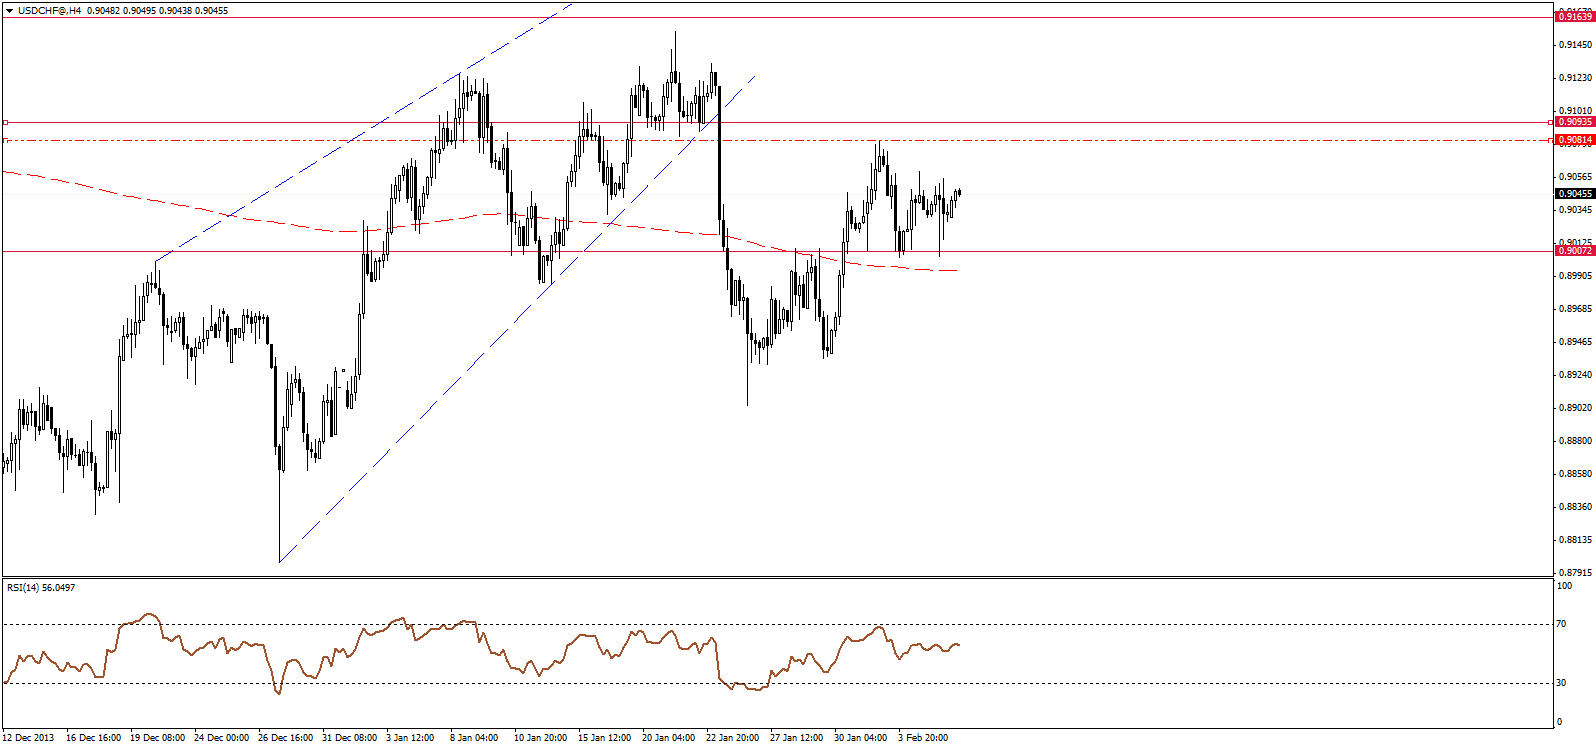
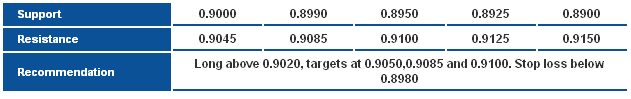
The USD/CHF continues to fluctuate in a sideways bias, as price was rejected of 0.9000 support level yesterday, attempting to resume the bullish rebound towards the recent minor swing high at0.9080. Overall, we remain positive as long as above 0.9000 support. A break below the latter may call for renewed bearish pressures.
 USD/CHF S&R Chart" title="USD/CHF S&R Chart" width="474" height="242">
 USD/CAD Hour Chart" title="USD/CAD Hour Chart" width="474" height="242">
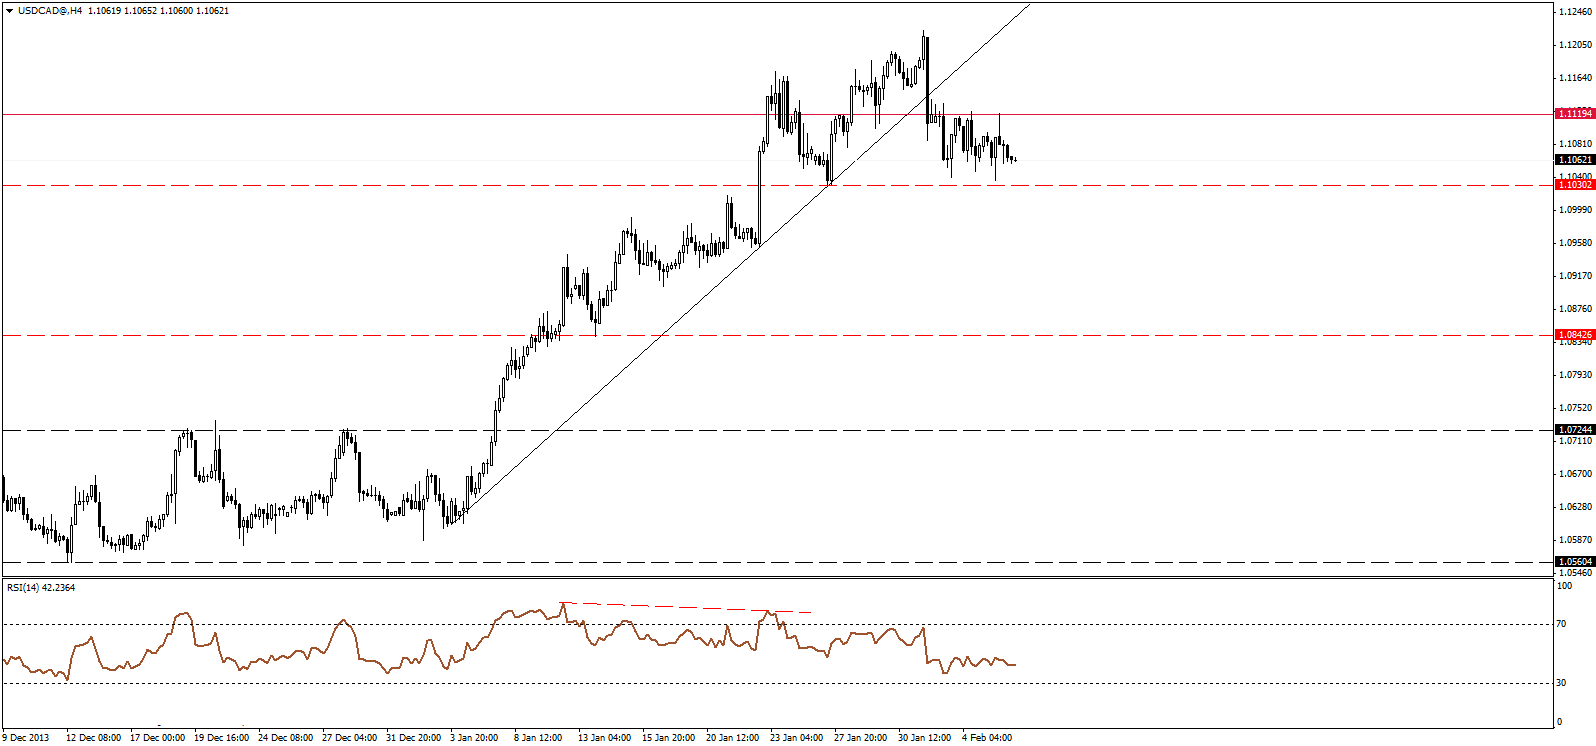
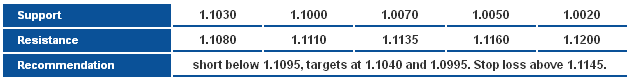
The USD/CAD is attempting to resume the bearish correction, as price was rejected one again after retesting 1.1120 resistance. The next key support is at 1.1030 which if broken should signal the continuation of the downside correction, eying levels near 1.0000 again. A break back above 1.1120 may renew the bullish bias.
 USD/CAD S&R Chart" title="USD/CAD S&R Chart" width="474" height="242">
 AUD/USD Daily Chart" title="AUD/USD Daily Chart" width="474" height="242">
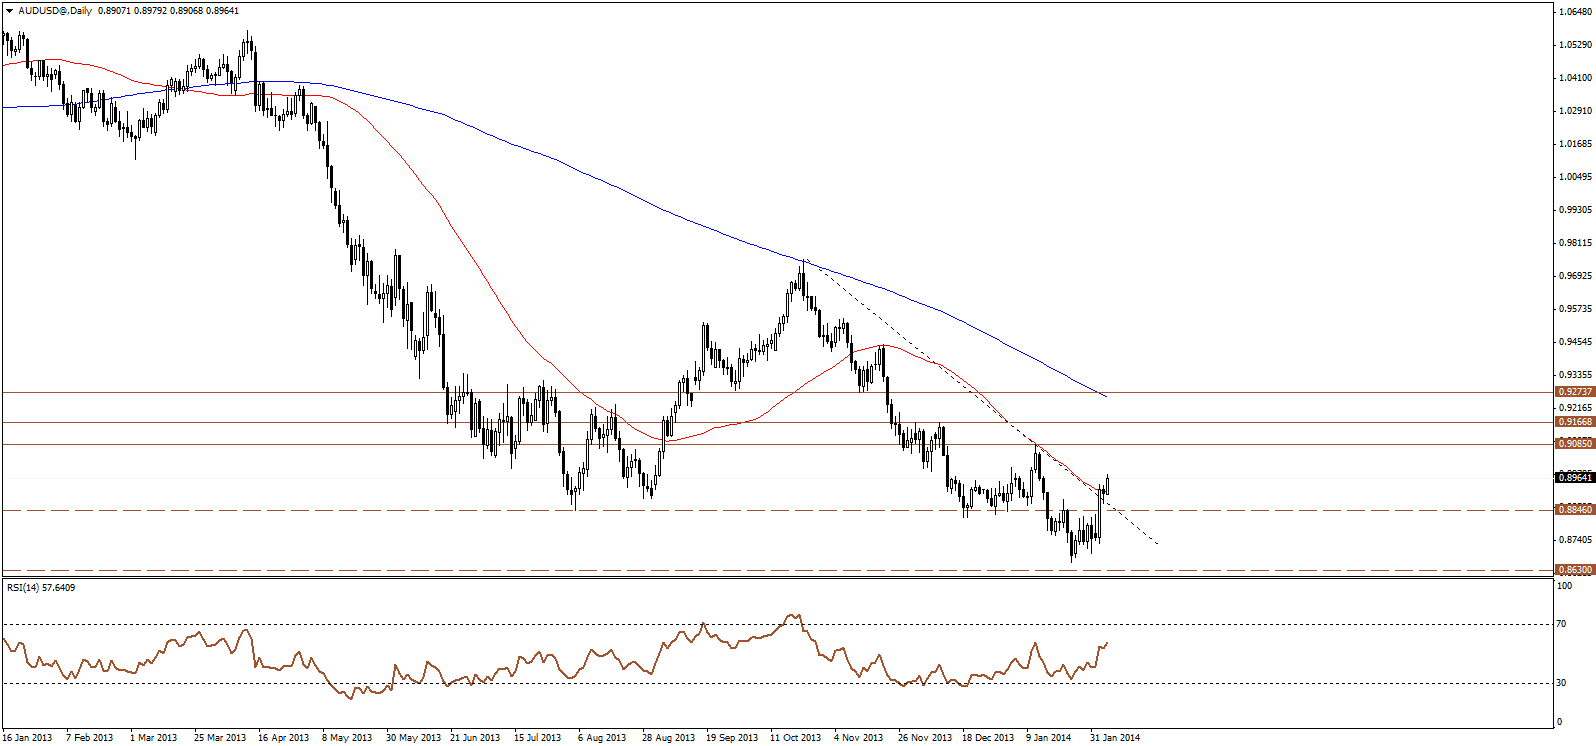
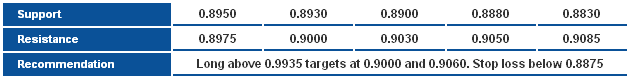
The AUD/USD extended the upside, breaking and settling above the -days SMA and the descending resistance for the overall bearish wave. Accordingly, we hold onto our bullish expectations for the pair in the near term targeting 0.9085 key resistance, Holding above 0.8875 should
 AUD/USD S&R Chart" title="AUD/USD S&R Chart" width="474" height="242">
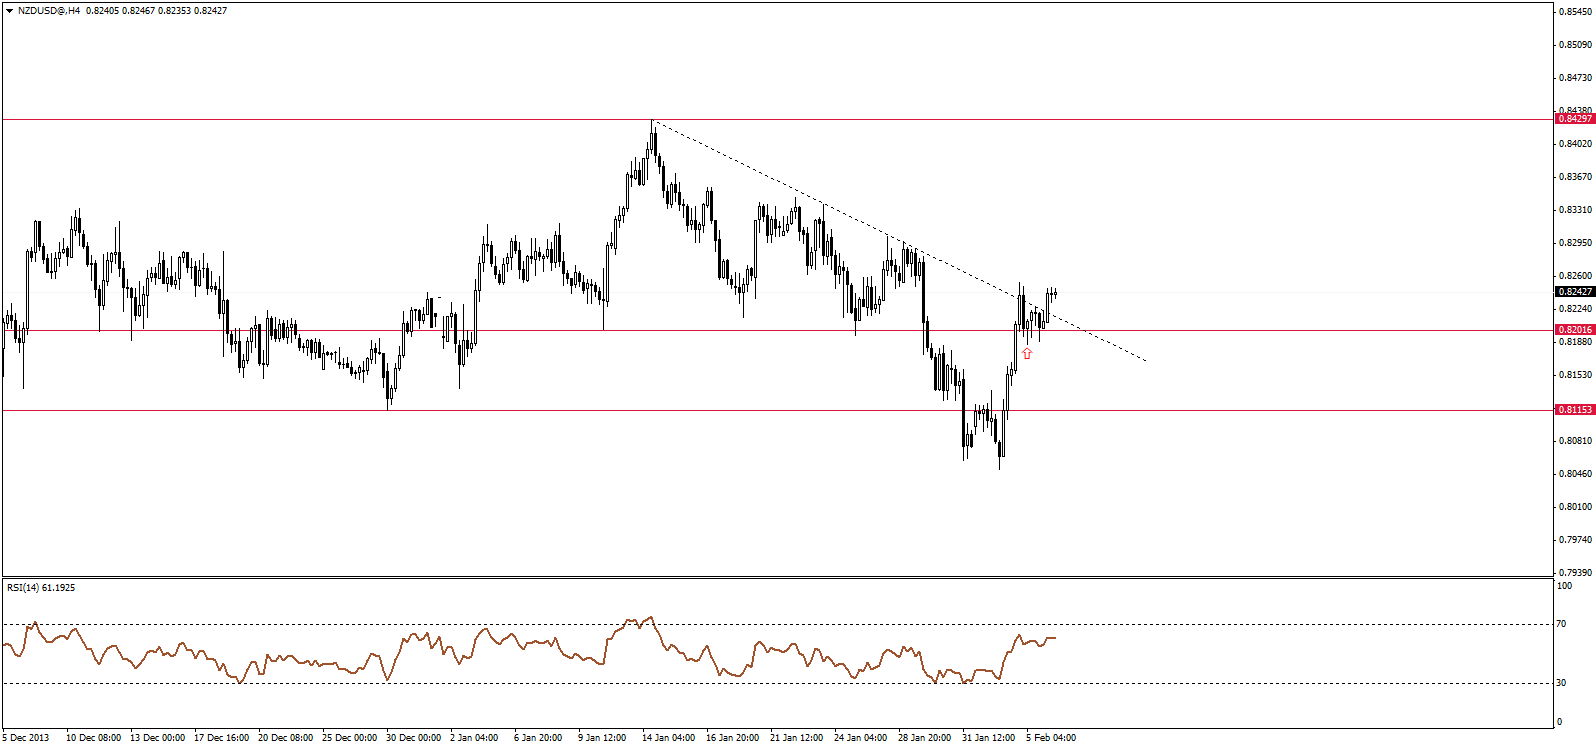 NZD/USD Hour Chart" title="NZD/USD Hour Chart" width="474" height="242">
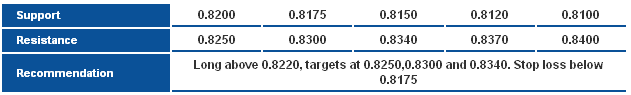
The NZD/USD broke above the descending resistance for the latest bearish wave, and maintains trading above 0.8200 horizontal support, and that indicate further upside potential. We hold onto our bullish bias targeting 0.8300 and 0.8340 as the next upside targets. 0.8185 should limit and downside move for this positivity to remain favored.
 NZD/USD S&R Chart" title="NZD/USD S&R Chart" width="474" height="242">