
European Session
EUR/USD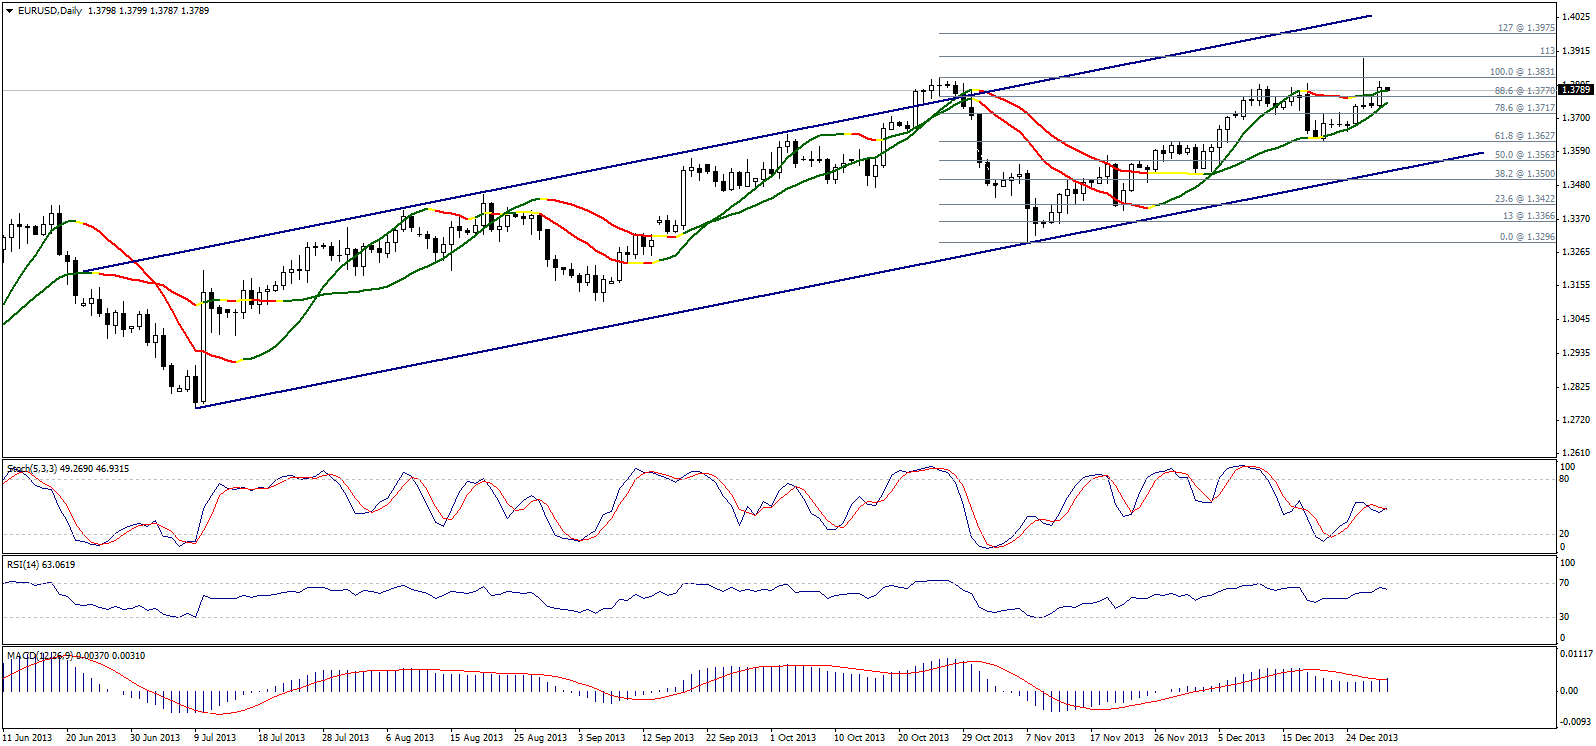 EUR/USD Daily Chart" title="EUR/USD Daily Chart" width="1596" height="747">
The pair moved to the upside yesterday and is limited below 1.3830 levels, but we find the pair stable above 1.3770 which indicates a new attempt to the upside, especially that the pair failed to break 1.3715 yesterday failing negativity. Henceforth, we think there is a new bullish attempt that remains valid by stabilizing above 1.3715. Of note, it is significant to break 1.3715 to trigger the negative expectations referred to in our weekly report yesterday. 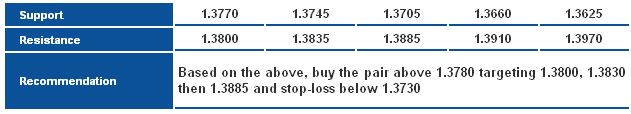 EUR/USD S&R Chart" title="EUR/USD S&R Chart" width="1596" height="747">
GBP/USD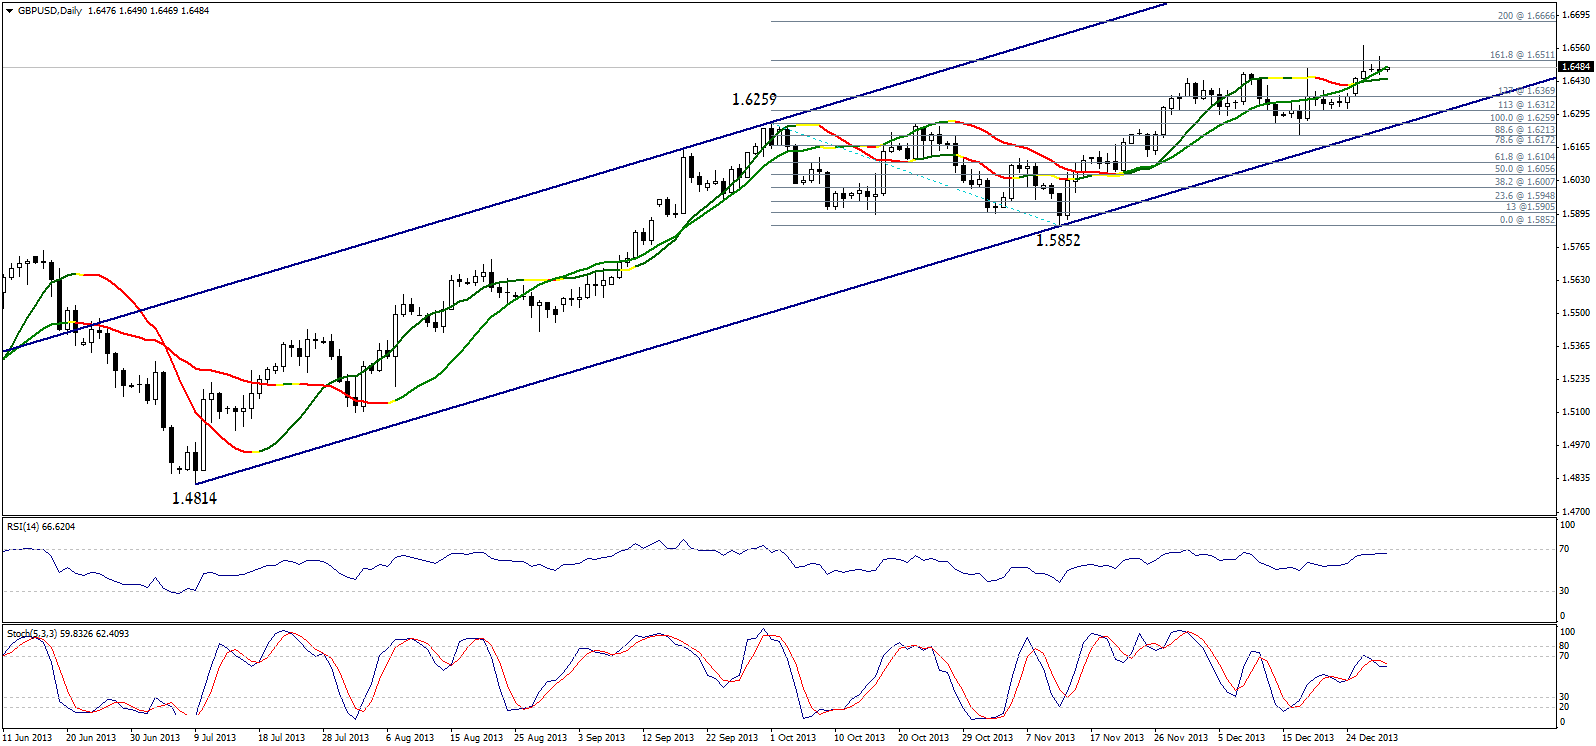 GBP/USD Daily Chart" title="GBP/USD Daily Chart" width="1596" height="747">
The pair is moving slightly to the upside, but trading is still very weak and limited below 161.8% correction represented in 1.6510. Breaching the referred to level is required to confirm bullishness, as we will wait for the referred to breach to bet on an upside move. Without breaching 1.6510, we prefer to remain neutral today. If the breach was confirmed, the positive expectations will be of trading within the ascending channel showing on graph.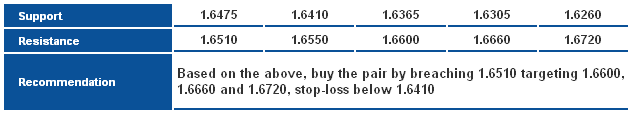 GBP/USD S&R Chart" title="GBP/USD S&R Chart" width="1596" height="747">
USD/JPY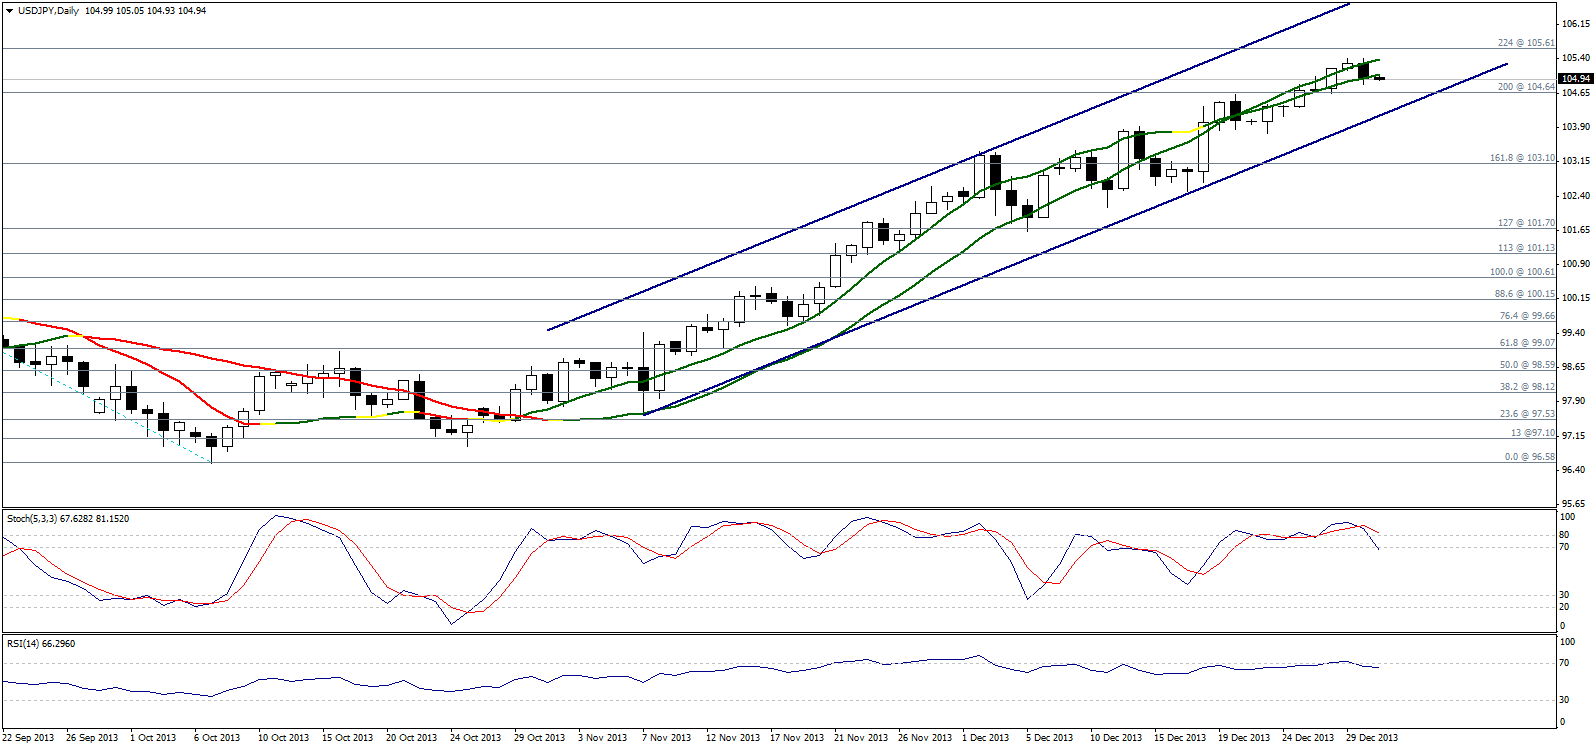 USD/JPY Daily Chart" title="USD/JPY Daily Chart" width="1596" height="747">
The pair dropped and stabilized below Linear Regression Indicators putting the pair under the negative signals showing on momentum indicators. Meanwhile, trading remains above key support level of the ascending channel. Therefore, despite expecting the general upside move to extend, we prefer to remain intraday neutral today because Risk/Reward Ratio is inappropriate, as we need to confirm stabilizing at 104.60 levels or breaking it before deciding on a trend.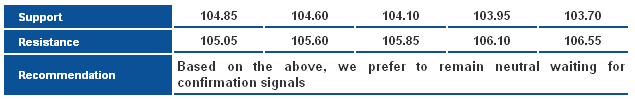 USD/JPY S&R Chart" title="USD/JPY S&R Chart" width="1596" height="747">
USD/CHF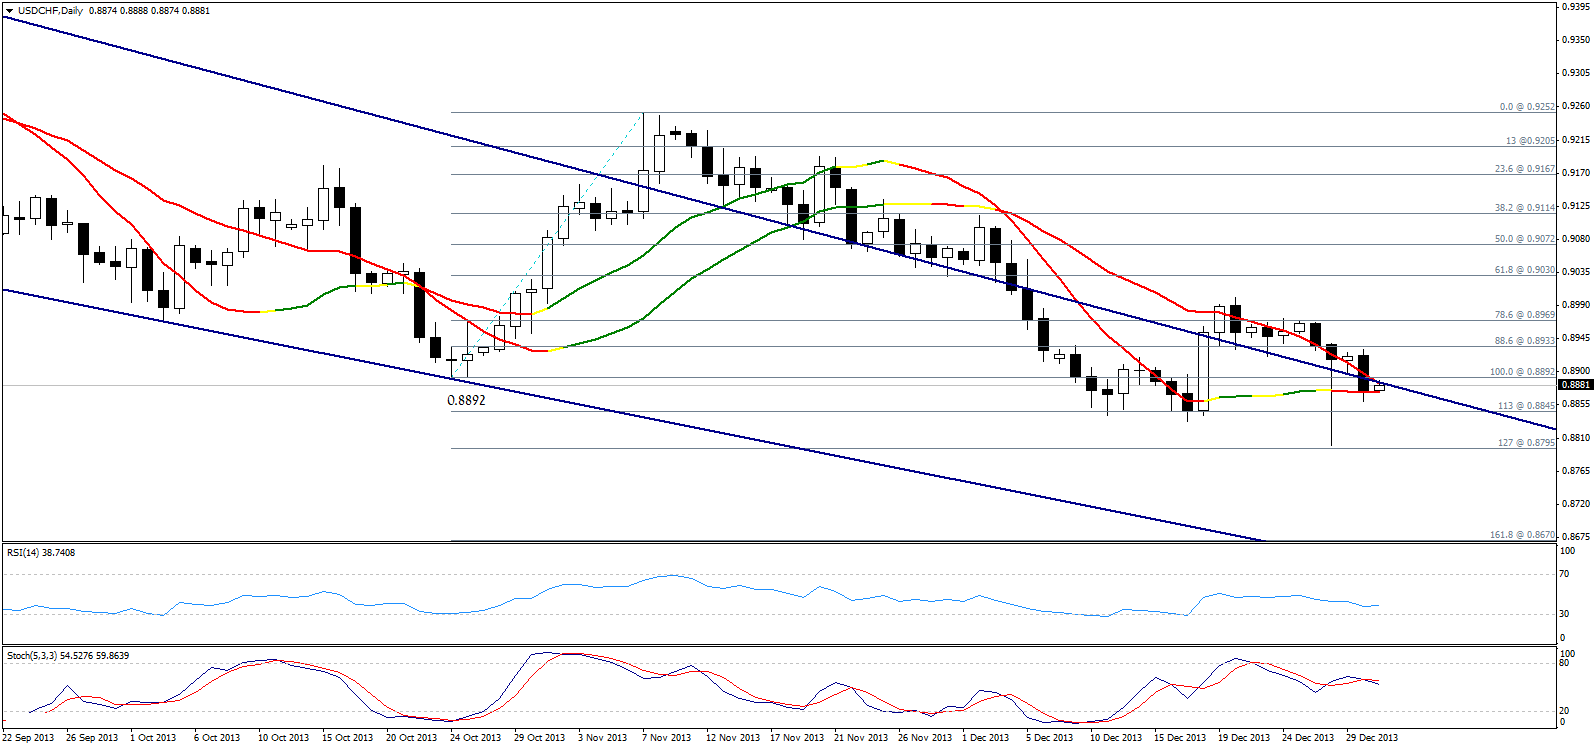 USD/CHF Daily Chart" title="USD/CHF Daily Chart" width="1596" height="747">
The pair dropped and is trading again below 0.8890 and below key resistance of the downside move as showing on graph. Meanwhile, the significant support level represented in 113% Fibonacci at 0.8845 is still stable. Therefore, we prefer to remain neutral, as trading between 0.8890 and 0.8845 makes it difficult to bet on a specific intraday move.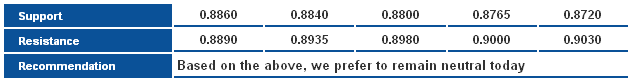 USD/CHF S&R" title="USD/CHF S&R" width="1596" height="747">
USD/CAD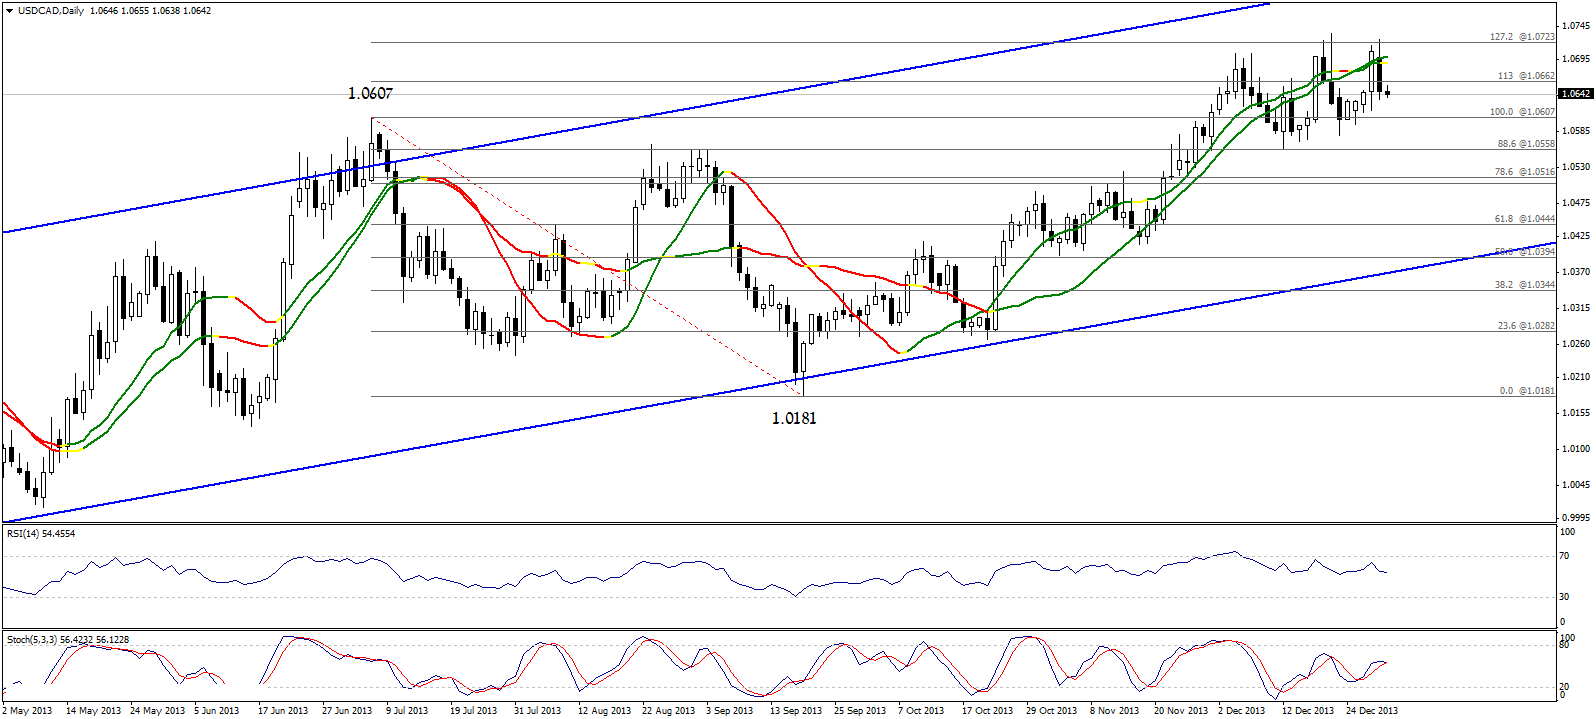 USD/CAD Daily Chart" title="USD/CAD Daily Chart" width="1596" height="747">
The pair witnessed a sharp downside move then confirmed failing to breach 127.2% Fibonacci represented in 1.0725, then broke 1.0660 levels and stabilized below Linear Regression Indicators. Therefore, the possibility of extending the downside move is valid, and the pair has to break 1.0605 to confirm this outlook.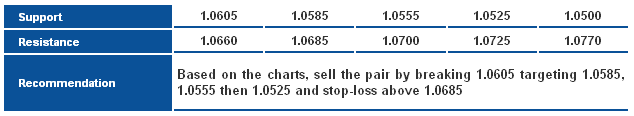 USD/CAD S&R Chart" title="USD/CAD S&R Chart" width="1596" height="747">