Political risks contribute to the growth of precious metals’ prices
Gold prices increase on the background of unceasing disagreements between the Republicans and the Democrats in the United States. At the same time, there is a possibility for the stock market to correct after the end of the quarterly earnings season. Will the XAUSnP quotes increase?
The XAUSnP instrument allows to build trading strategies based on gold and the US stock market. It increases when precious metals grow, and the S&P 500 stock index decreases. The investigation of Donald Trump’s victory conditions in the presidential elections in November 2016 resumed in the US. In addition, the US Senate and the House of Representatives offer two different versions of the tax reform. Their discussion may take a long time. All these increase political risks and contribute to the growth of precious metals’ quotes.
An additional factor in favor of the price growth of gold may become the political crisis in Germany. Angela Merkel’s party - the Christian Democratic Union of Germany, won the parliamentary elections in September 2017 but gained the minimum number of votes since 1949. Because of this, they have not yet managed to form a government in Germany. The Christian-Democratic Union does not succeed in forming a coalition with other parties. This week the trades in the US stock market may be inactive due to the Thanksgiving holiday, which will be held on Thursday.

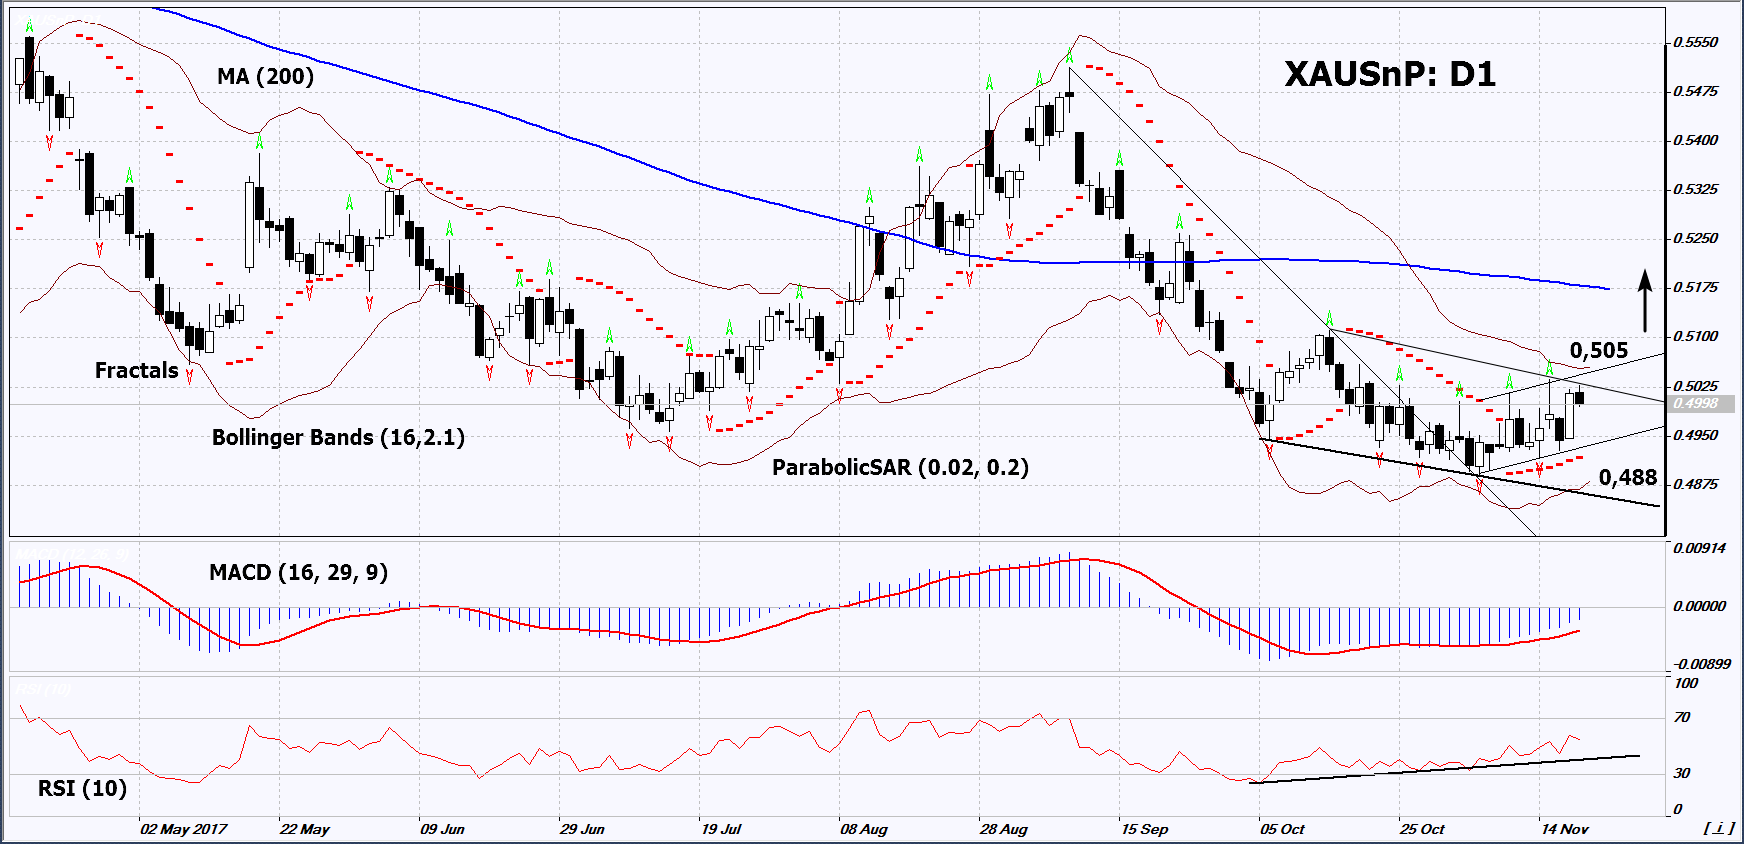
On the daily timeframe, XAUSnP: D1 shows a bullish trend. Meanwhile, it continues to remain in the short-term decreasing channel. Further price growth is possible in case of the worsening of the US economy and the escalation of political risks.
- The Parabolic indicator gives a bullish signal.
- The Bollinger bands have narrowed, which means lower volatility. They are tilted upwards.
- The RSI indicator is above 50. It has formed a positive divergence.
- The MACD indicator gives a bullish signal.
The bearish momentum may develop in case XAUSnP exceeds the last fractal high and the upper Bollinger band at 0.505. This level may serve as an entry point. The initial stop loss may be placed below the 10-year low, the two last fractal lows, the lower Bollinger band and the Parabolic signal at 0.488. After opening the pending order, we shall move the stop to the next fractal low following the Bollinger and Parabolic signals. Thus, we are changing the potential profit/loss to the breakeven point. More risk-averse traders may switch to the 4-hour chart after the trade and place there a stop loss moving it in the direction of the trade. If the price meets the stop level at 0.488 without reaching the order at 0.505, we recommend cancelling the position: the market sustains internal changes that were not taken into account.
Summary of technical analysis
Position - Buy
Buy stop - above 0,505
Stop loss - below 0,488
