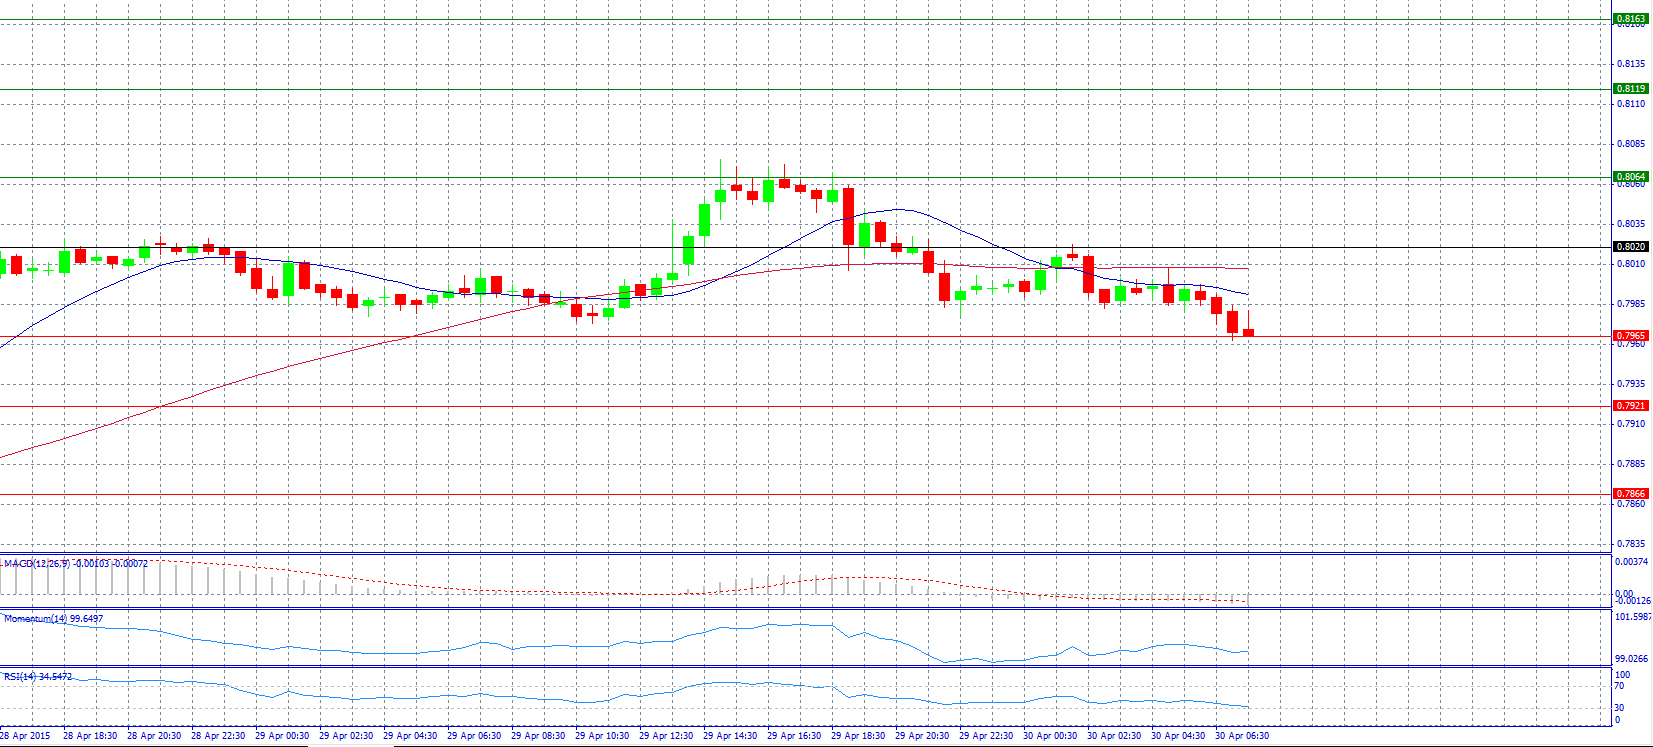
Market Scenario 1: Long positions above 0.8020 with target @ 0.8064.
Market Scenario 2: Short positions below 0.7965 with target @ 0.7921.
Comment: The pair trades on a weaker footing in the Asian session.
Supports and Resistances:
R3 0.8163
R2 0.8119
R1 0.8064
PP 0.8020
S1 0.7965
S2 0.7921
S3 0.7866
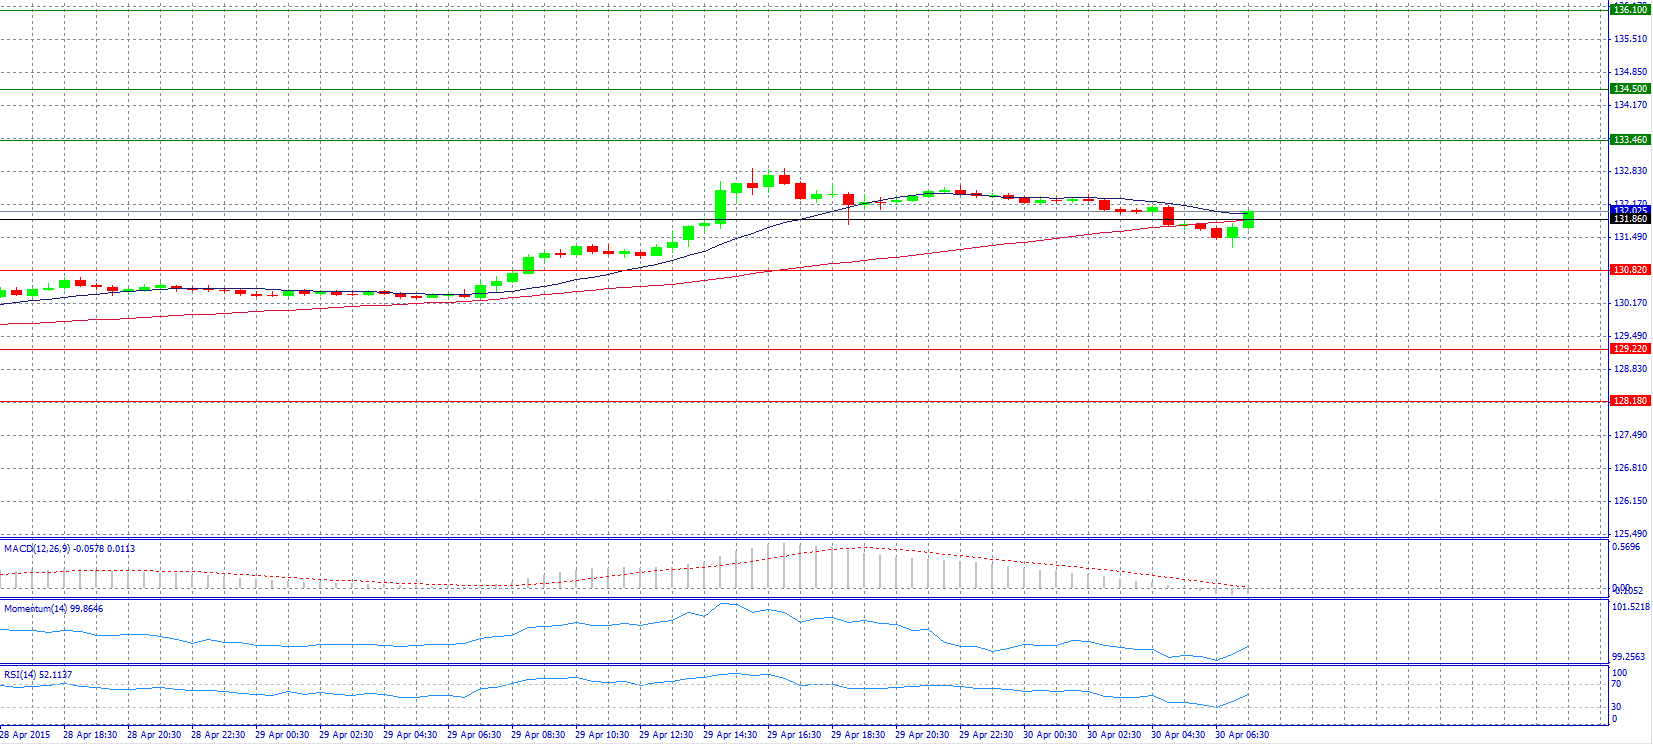
Market Scenario 1: Long positions above 131.86 with target @ 133.46.
Market Scenario 2: Short positions below 131.86 with target @ 130.82.
Comment: The pair loses 132.00 level on BOJ non-event.
Supports and Resistances:
R3 136.10
R2 134.50
R1 133.46
PP 131.86
S1 130.82
S2 129.22
S3 128.18
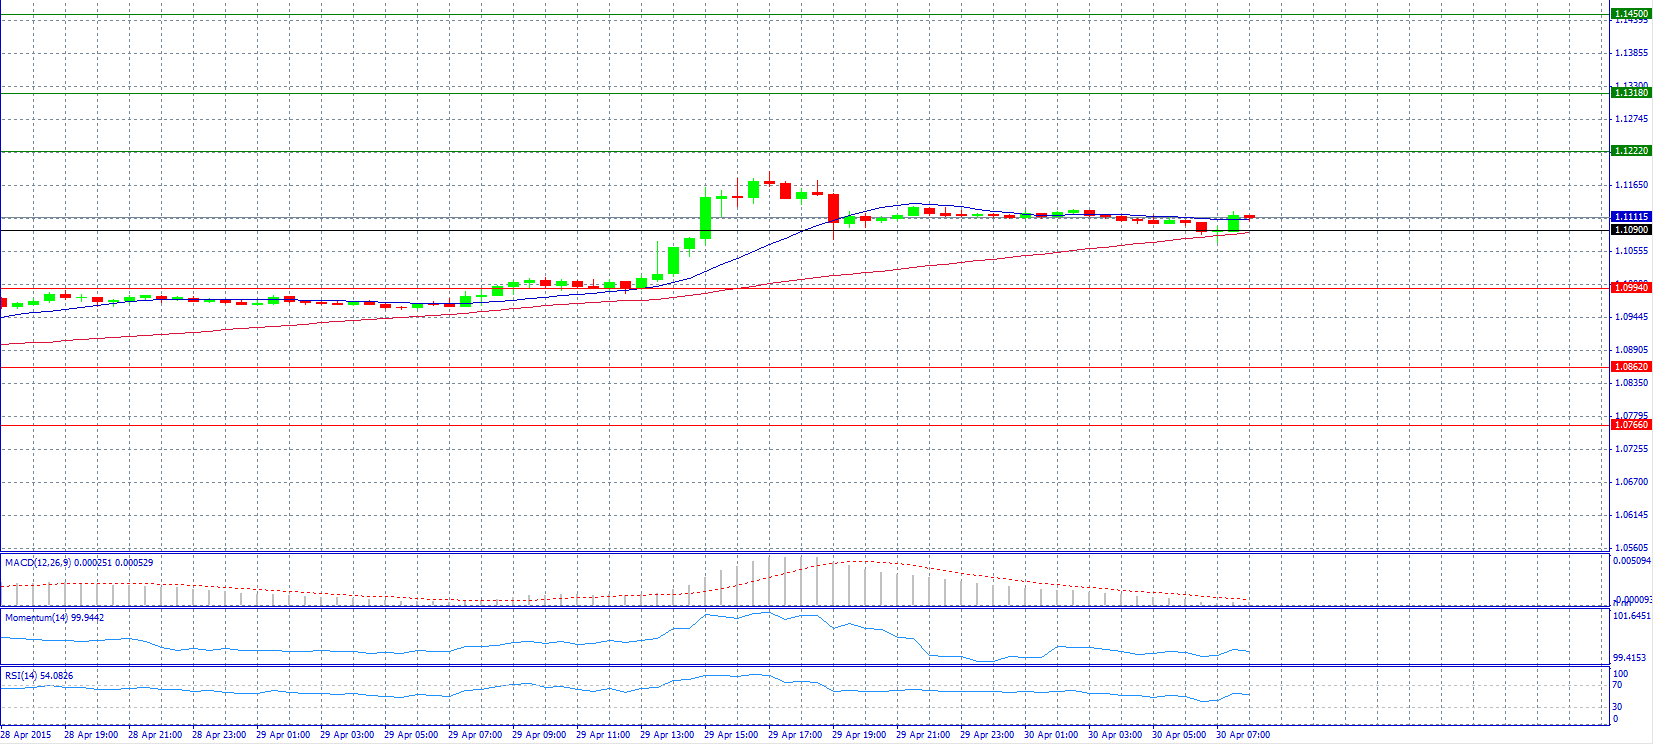
Market Scenario 1: Long positions above 1.1090 with target @ 1.1222.
Market Scenario 2: Short positions below 1.1090 with target @ 1.0994.
Comment: The pair tested support level at pivot point 1.1090 and now trades near 1.1110 level.
Supports and Resistances:
R3 1.1450
R2 1.1318
R1 1.1222
PP 1.1090
S1 1.0994
S2 1.0862
S3 1.0766
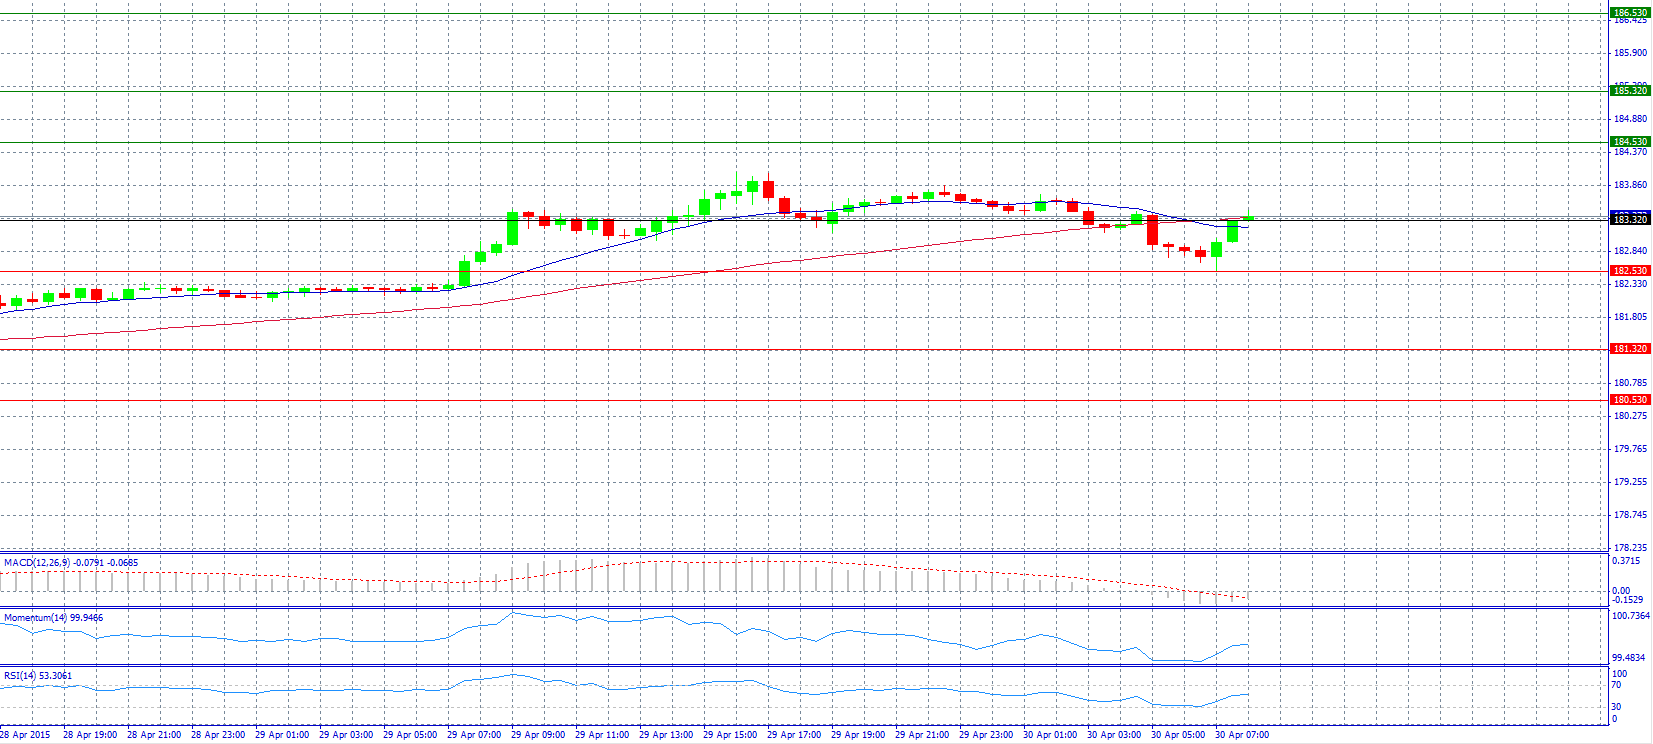
Market Scenario 1: Long positions above 183.32 with target @ 184.53.
Market Scenario 2: Short positions below 183.32 with target @ 182.53.
Comment: The pair strengthened and surpassed 183.30 level.
Supports and Resistances:
R3 186.53
R2 185.32
R1 184.53
PP 183.32
S1 182.53
S2 181.32
S3 180.53
Market Scenario 1: Long positions above 1.5420 with target @ 1.5514.
Market Scenario 2: Short positions below 1.5420 with target @ 1.5344.
Comment: The pair ran into offers close to 1.5450 in the Asian session on Thursday, after having seen the longest winning streak since 2012.
Supports and Resistances:
R3 1.5684
R2 1.5590
R1 1.5514
PP 1.5420
S1 1.5344
S2 1.5250
S3 1.5174
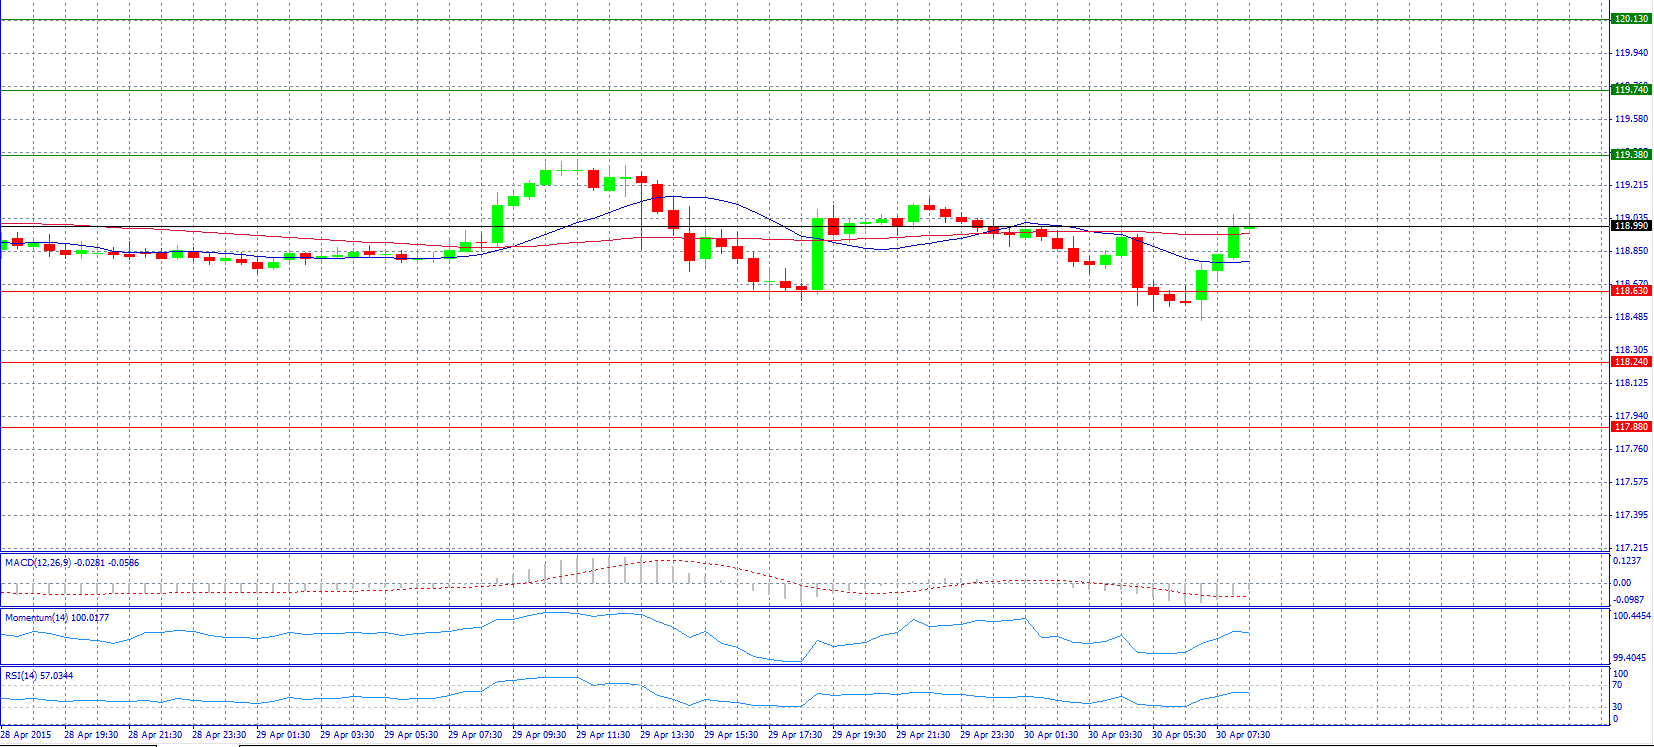
Market Scenario 1: Long positions above 118.99 with target @ 119.38.
Market Scenario 2: Short positions below 118.99 with target @ 118.63.
Comment: The pair recovers and tries to break resistance level at pivot point 118.99.
Supports and Resistances:
R3 120.13
R2 119.74
R1 119.38
PP 118.99
S1 118.63
S2 118.24
S3 117.88

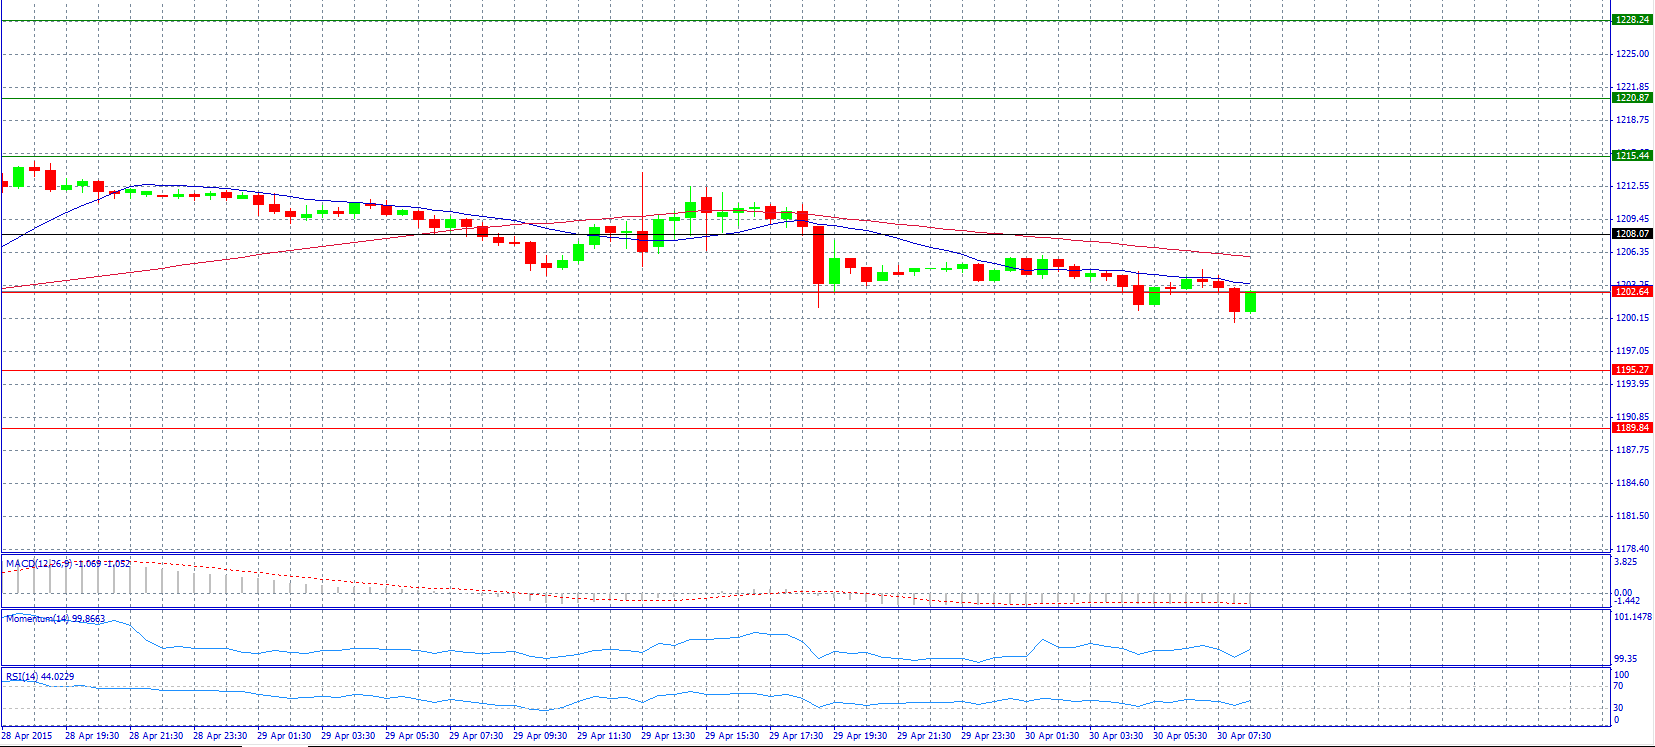
Market Scenario 1: Long positions above 1202.64 with target @ 1208.07.
Market Scenario 2: Short positions below 1202.64 with target @ 1195.27.
Comment: Gold prices weakened moderately to a low of 1200.60 level during the Asian session.
Supports and Resistances:
R3 1228.24
R2 1220.87
R1 1215.44
PP 1208.07
S1 1202.64
S2 1195.27
S3 1189.84
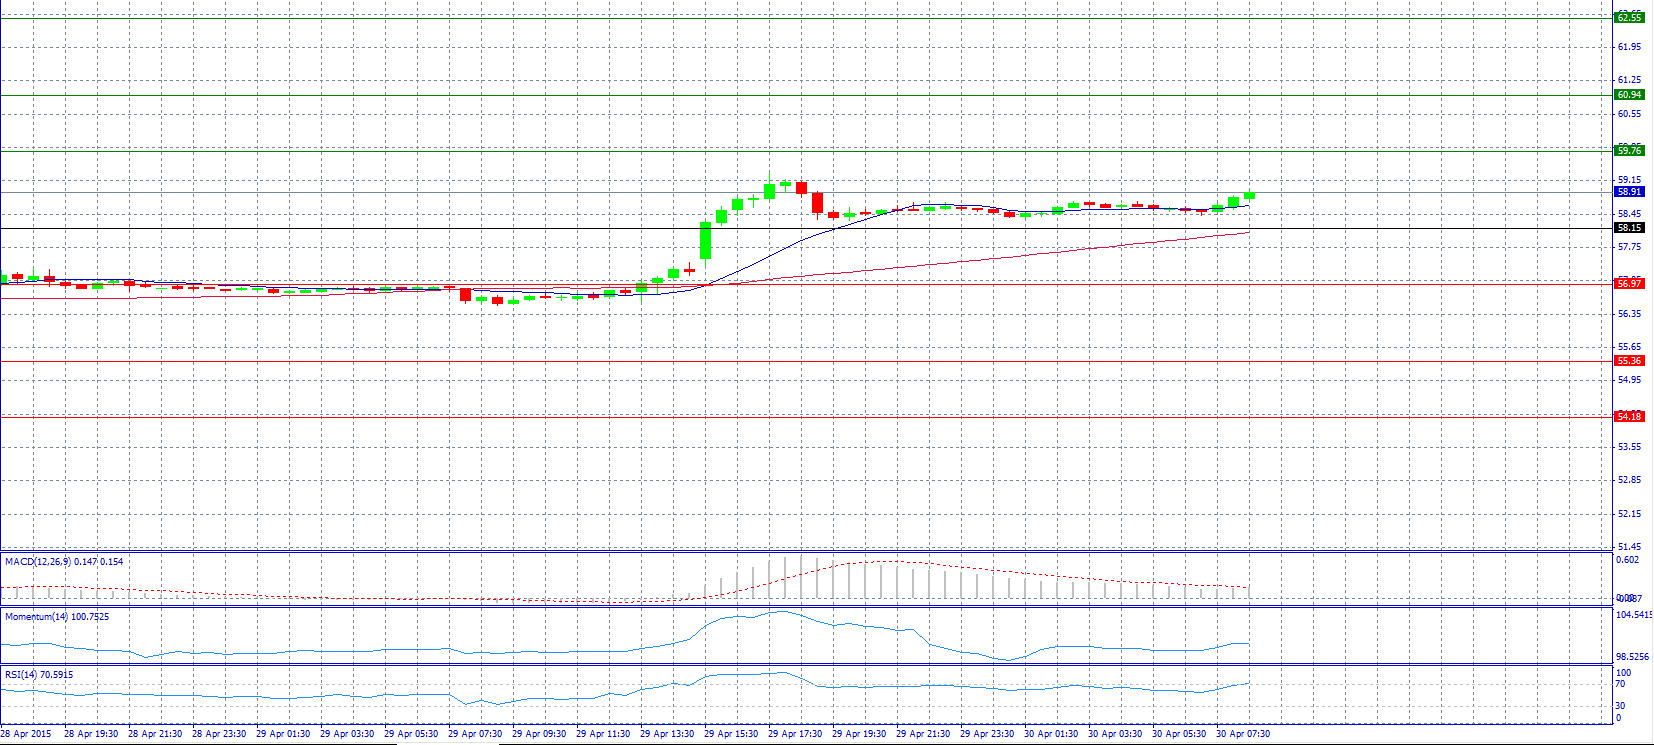
Market Scenario 1: Long positions above 59.76 with target @ 60.94.
Market Scenario 2: Short positions below 58.15 with target @ 56.97.
Comment: Crude oil prices may be readying to turn lower anew due to negative RSI divergence hints.
Supports and Resistances:
R3 62.55
R2 60.94
R1 59.76
PP 58.15
S1 56.97
S2 55.36
S3 54.18
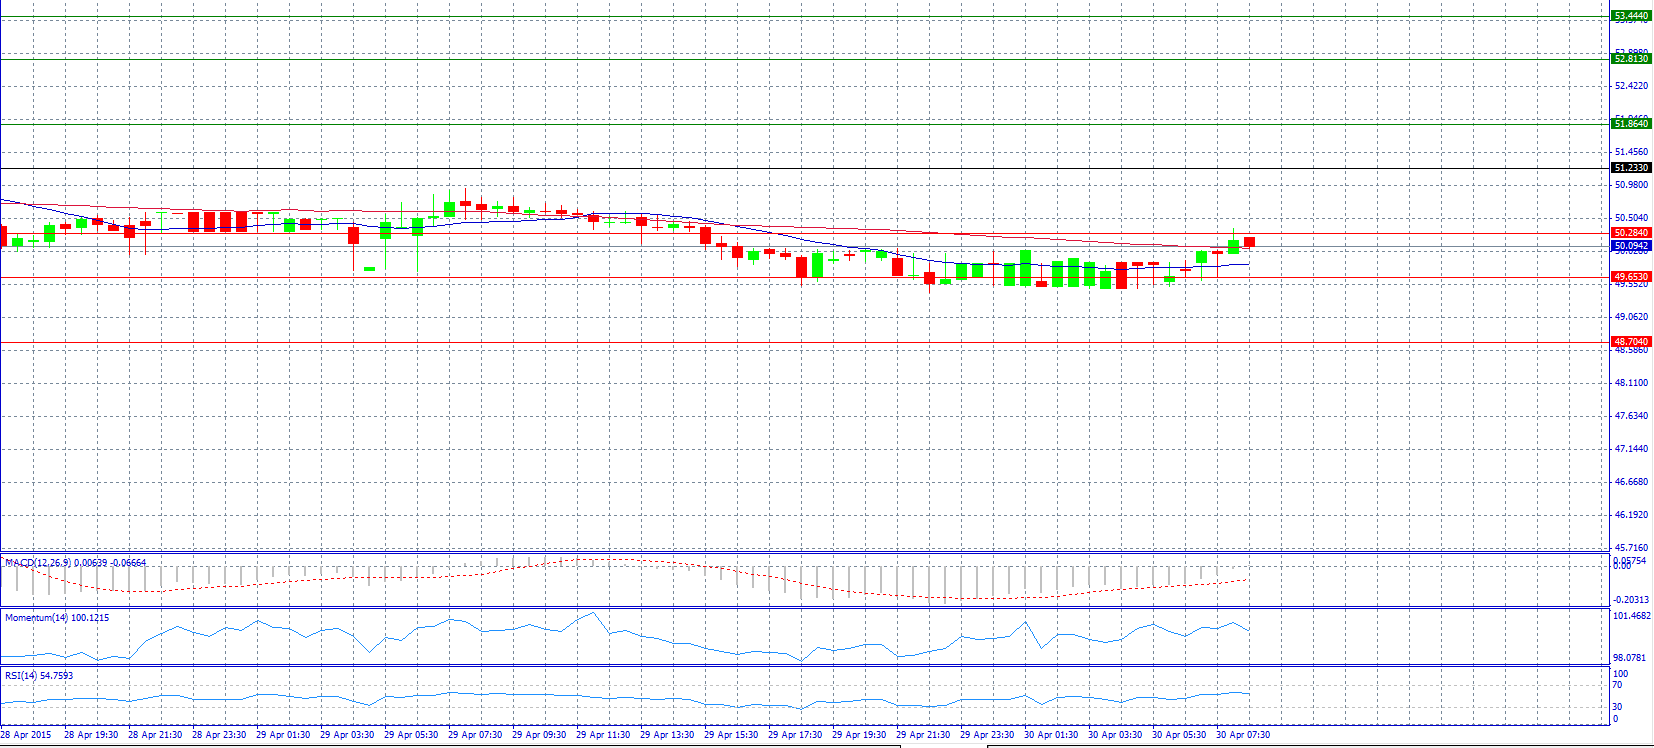
Market Scenario 1: Long positions above 50.284 with target @ 51.233.
Market Scenario 2: Short positions below 49.653 with target @ 48.704.
Comment: The pair is testing resistance level 50.284.
Supports and Resistances:
R3 53.444
R2 52.813
R1 51.864
PP 51.233
S1 50.284
S2 49.653
S3 48.704
