: 54%
VIX Status: 15.5%
General (Short-term) Trading Call: Hold with a bullish bias
Reference Charts (click for view of last 6 months from Stockcharts.com):
Commentary
Sellers did not come close to reversing the S&P 500′s big breakout on March 13th, but they got close to wiping out the latest breakout from Monday’s big rally. The following intra-day chart with 15-minute intervals shows how buyers stepped in just in time to preserve the breakout.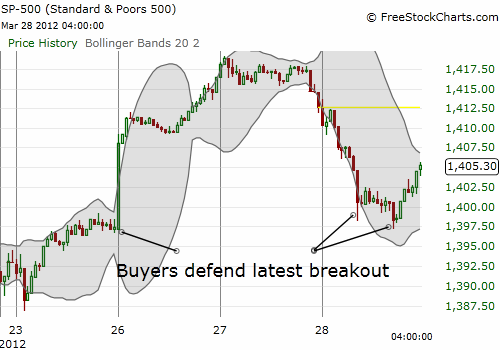
Buyers step up just in time
I know it must have seemed strange that I was unloading my last batch of SSO calls into Monday’s rally and Tuesday’s open, but I think Tuesday’s weak close and Wednesday’s small sell-off confirm (once again) that the current trading strategy is the correct one. Wednesday’s dip also finally delivered a fresh fistful of SSO calls at my lowball limit price. By the close, these calls had already gained 35%. These calls expire Friday, so I will obviously not be holding them much longer. I strongly suspect those institutions and traders who must show good books for this first quarter are going to be eagerly buying into this dip either Thursday or Friday (barring some large negative catalyst of course).
The S&P 500 was down as much as 1.1% on Wednesday, qualifying for a major sell-off in the current market environment. The fear this generated showed clearly in the volatility index. The VIX was up an incredible 13.0% at its highest point. If the stock market was in the middle of a sell-off, contrarians would have pounded the table to buy stocks on the assumption fear was finally reaching a climax. With that in mind, I continued to fade VXX, the iPath S&P 500 VIX Short-Term Futures, with puts. Sure enough, by the close, volatility quickly collapsed back to Tuesday’s close. VXX ended the day with a fractional gain. This should complete an impressive bounce from Monday’s bottom that took VXX as much as 20.3% higher. I am assuming the downtrend as usual is now underway.
The on-going weakness in Caterpillar (CAT) continues to goad the queasy bull inside me. Today, the stock closed at new lows for March, confirming a failed retest of the 50DMA resistance. The stock looks ready to start a downtrend now. I may soon need to sell my recent shares and focus on building a larger bearish position against CAT and its heavy machinery “cousin” Terex (TEX).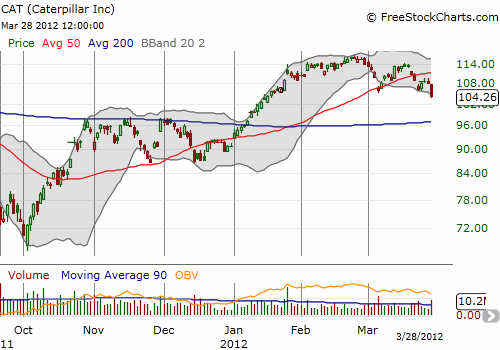
Caterpillar is breaking down
Note well, Caterpillar jumped an amazing 74% from the October, 2011 lows in just four short months. So, any kind of pullback should come as no surprise. The main problem here is that the S&P 500 (and of course tech stocks) have managed several new highs since CAT peaked in February. CAT is delivering a non-confirmation signal that will get more ominous the longer CAT’s weakness persists.
The sell-off in early March that put an exclamation mark on CAT’s recent peak, also marks what I can now see as a definitive turning point for T2108. Since that point, T2108 has only managed to return to overbought territory for one day (March 13th). Although T2108 has since dropped to the current 54% and as low as 48%, the S&P 500 remains a few points higher than its close when the last overbought period ended. I drew some trend lines on T2108 just for context. These trendlines may provide some guidance on what to expect going forward. Interestingly, T2108 has generally been making higher lows ever since the August swoon. T2108 changed character in February at its highs and is now also printing lower highs. The trends suggest then that we should not expect overbought or oversold conditions for several more weeks. For some more context, note that the current lull is not unusual: the average duration between overbought periods is 30.9 days, the media is 7.0 days. 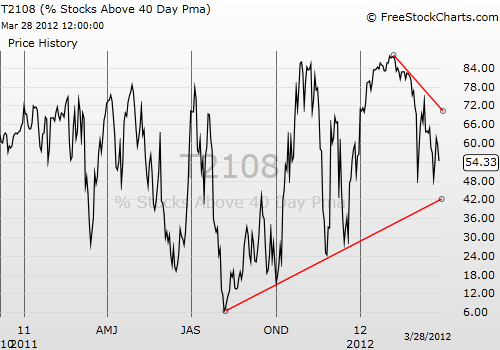
T2108 seems to be slowly heading toward a big resolution
The steady decline in T2108 even as the S&P 500 churns higher suggests that the leaders are thinning. However, these leaders are managing to keep the market floating with a positive bias. Apple (AAPL) is the current flag bearer. For example, on Tuesday OptionMonster reported on TheStreet.com the following incredible statistic:
“Weekly options that expire this Friday dominate options activity in the tech giant having already traded more than 236,000 contracts. Volume at that single expiration month in AAPL is more than total volume for every other company in the market except for Bank of America (BAC).”
This has to make me wonder how much more trading in Apple will it take to suck in all the market’s spare capacity for buying! Regardless, this kind of strong call action moves stocks. In “Apple’s Big Mystery Buyer In Q1 2012,” a Seeking Alpha author seems to have crunched the numbers to prove call buyers are primarily responsible for pushing Apple upward ever higher.
Bears will assume that it is a matter of time before the strong leaders succumb and take T2108 to oversold levels. The bulls will be encouraged by the prospects of the laggards turning around and sending the market ever higher. The tiebreaker rests with the data…which, again, tells us clearly that we should give the bullish case the benefit of the doubt given the historic overbought run we experienced to start the year. Amazon (AMZN) is one example of a laggard that is finally waking up to provide reinforcements.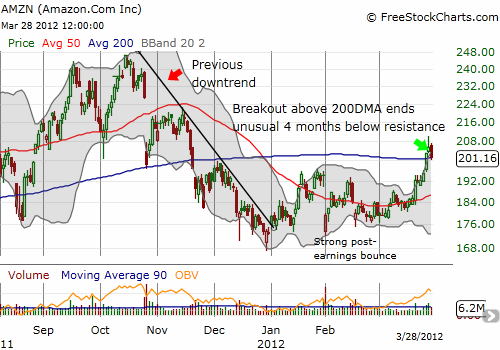
AMZN finally tries to play catch-up
I bought March 205/210 calls on this pullback assuming that the 200DMA will now serve as firm support. The short 210 calls allow me to enter the 205 calls at a cheaper price; I do not expect AMZN to get over 210 by Friday. By the way, Tuesday’s follow-through on the breakout featured some heavy call buying in AMZN; glad I waited! Again, from OptionMonster:
“Amazon.com(AMZN) is also drawing fast-money trades as buyers snap up its weekly 205 calls, 210 calls and 215 calls. Weekly volume in the e-commerce giant is approaching 48,000 contracts — more than 27 times the average amount. AMZN rose 3.07 percent to $209.10.”
Charts below are the latest snapshots of T2108 (and the S&P 500) Refresh browser if the charts are the same as the last T2108 update.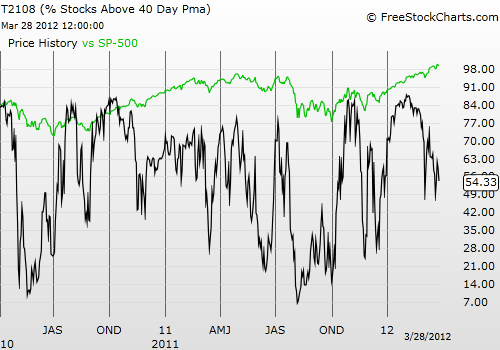
Black line: T2108 (measured on the right); Green line: S&P 500 (for comparative purposes)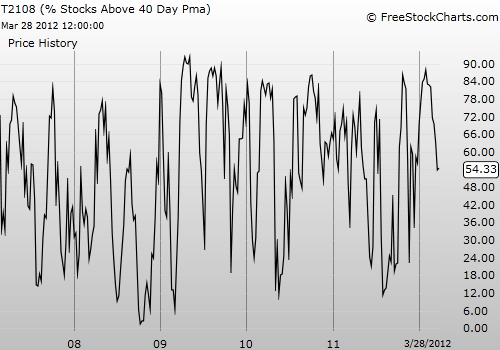
Be careful out there!
Full disclosure: long SDS; long SSO calls; long VXX calls and puts; long CAT shares and puts; long TEX puts; long AMZN call spread
- English (UK)
- English (India)
- English (Canada)
- English (Australia)
- English (South Africa)
- English (Philippines)
- English (Nigeria)
- Deutsch
- Español (España)
- Español (México)
- Français
- Italiano
- Nederlands
- Português (Portugal)
- Polski
- Português (Brasil)
- Русский
- Türkçe
- العربية
- Ελληνικά
- Svenska
- Suomi
- עברית
- 日本語
- 한국어
- 简体中文
- 繁體中文
- Bahasa Indonesia
- Bahasa Melayu
- ไทย
- Tiếng Việt
- हिंदी
T2108 Update – March 28, 2012 (Buyers Defend Latest Breakout)
Published 03/28/2012, 09:09 AM
Updated 07/09/2023, 06:31 AM
T2108 Update – March 28, 2012 (Buyers Defend Latest Breakout)
T2108 Status
3rd party Ad. Not an offer or recommendation by Investing.com. See disclosure here or
remove ads
.
Latest comments
Install Our App
Risk Disclosure: Trading in financial instruments and/or cryptocurrencies involves high risks including the risk of losing some, or all, of your investment amount, and may not be suitable for all investors. Prices of cryptocurrencies are extremely volatile and may be affected by external factors such as financial, regulatory or political events. Trading on margin increases the financial risks.
Before deciding to trade in financial instrument or cryptocurrencies you should be fully informed of the risks and costs associated with trading the financial markets, carefully consider your investment objectives, level of experience, and risk appetite, and seek professional advice where needed.
Fusion Media would like to remind you that the data contained in this website is not necessarily real-time nor accurate. The data and prices on the website are not necessarily provided by any market or exchange, but may be provided by market makers, and so prices may not be accurate and may differ from the actual price at any given market, meaning prices are indicative and not appropriate for trading purposes. Fusion Media and any provider of the data contained in this website will not accept liability for any loss or damage as a result of your trading, or your reliance on the information contained within this website.
It is prohibited to use, store, reproduce, display, modify, transmit or distribute the data contained in this website without the explicit prior written permission of Fusion Media and/or the data provider. All intellectual property rights are reserved by the providers and/or the exchange providing the data contained in this website.
Fusion Media may be compensated by the advertisers that appear on the website, based on your interaction with the advertisements or advertisers.
© 2007-2024 - Fusion Media Limited. All Rights Reserved.
