
Buoyed by higher revenues, Synovus Financial Corporation (NYSE:SNV) recorded a positive earnings surprise of 4.3% in second-quarter 2016 which aided 1.3% jump in its share price. Adjusted earnings of 49 cents per share beat the Zacks Consensus Estimate by 2 cents. Also, the reported figure compared favorably with the prior-year quarter tally of 42 cents.
Higher revenues and strong loans & deposits balances drove the organic growth. However, escalating expenses remain a concern. Moreover, low net interest margin added to its woes.
Net income available to common shareholders was $57.9 million or 46 cents per share compared with $53.2 million or 40 cents per share in the prior-year quarter.
Organic Growth Reflected; Costs Rise
Total revenue (net of interest expense) in the second quarter was $289.3 million, up 6.2% from $272.4 million in the prior-year quarter. Moreover, the top line marginally exceeded the Zacks Consensus Estimate of $289 million.
Net interest income increased 8.7% year over year to $221.4 million. However, net interest margin inched down 12 basis points (bps) year over year to 3.27%.
Non-interest income slightly fell 1.4% year over year to $67.9 million. The decrease was primarily due to lower mortgage-banking revenues, fiduciary and asset management fees and bankcard fees. These negatives were, however, partially offset by elevated fee income, brokerage income and other non-interest income.
Total non-interest expenses were $188.6 million, up 6.1% year over year; while adjusted non-interest expenses were $182.4 million, up 5.4% on a year-over-year basis. Non-interest expenses exhibited a rise in almost all components of expenses.
Total deposits came in at $23.9 billion, up 5.8% year over year. Total net loans climbed 7.5% year over year to $22.8 billion.
Credit Quality: A Mixed Bag
Credit quality metrics for Synovus were a mixed bag in the quarter.
Net charge-offs were $6.1 million, up 15.6% year over year. The annualized net charge-off ratio was 0.11%, up 1 basis point from the prior-year quarter. Provision for loan losses increased around 1% year over year to $6.7 million.
Non-performing loans, excluding loans held for sale, dropped 11.3% year over year to $154.1 million. The non-performing loan ratio was 0.67%, down 14 bps year over year.
Additionally, total non-performing assets amounted to $187.4 million, down 22% year over year. The non-performing asset ratio dipped 30 bps to 0.81% year over year.
Strong Capital Position
Synovus’ capital position remained strong as on Jun 30, 2016.
Tier 1 capital ratio and total risk based capital ratio were 10.06% and 12.05%, respectively, compared with 10.73% and 12.18% as of Jun 30, 2015.
As of Jun 30, 2016, Common Equity Tier 1 Ratio (fully phased-in) was 9.49% compared with 10.09% in the prior-year quarter. Tier 1 Leverage ratio was 9.10% compared with 9.48% in the prior-year quarter.
Synovus repurchased shares worth $60.5 million of common stock during the second-quarter 2016.
Our Viewpoint
Results of Synovus reflect a decent performance in the quarter. We believe the company’s efforts toward reducing expenses and streamlining business will gradually pay off and aid bottom-line expansion in subsequent years. Moreover, the company exhibits a healthy capital position and strong revenues, which we believe will sustain its future performance.
However, a low rate environment and stringent regulations, continue to keep us apprehensive.
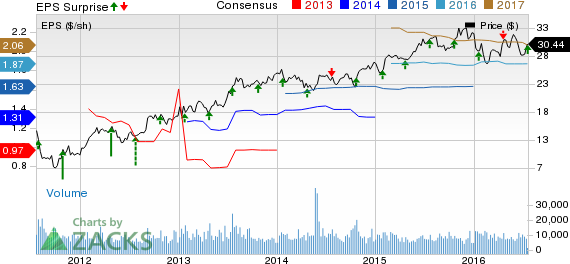
SYNOVUS FINL CP Price, Consensus and EPS Surprise
SYNOVUS FINL CP Price, Consensus and EPS Surprise | SYNOVUS FINL CP Quote
Currently, Synovus carries a Zacks Rank #3 (Hold).
Performance of Other Banks
Among other banks, Regions Financial Corporation’s (NYSE:RF) second-quarter 2016 earnings from continuing operations came in at 20 cents per share, in line with the Zacks Consensus Estimate and stable year over year. On an adjusted basis, earnings per share would have been 21 cents.
U.S. Bancorp (NYSE:USB) reported a positive surprise of 2.5% in the second-quarter 2016. The company reported earnings per share of 83 cents, beating the Zacks Consensus Estimate by 2 cents. Results also exceeded the prior-year quarter earnings of 80 cents.
The PNC Financial Services Group, Inc.’s (NYSE:PNC) second-quarter 2016 earnings per share of $1.82 neatly beat the Zacks Consensus Estimate of $1.75. However, the bottom line declined 3% year over year.
Want the latest recommendations from Zacks Investment Research? Today, you can download 7 Best Stocks for the Next 30 Days.Click to get this free report >>
PNC FINL SVC CP (PNC): Free Stock Analysis Report
US BANCORP (USB): Free Stock Analysis Report
REGIONS FINL CP (RF): Free Stock Analysis Report
SYNOVUS FINL CP (SNV): Free Stock Analysis Report
Original post
Zacks Investment Research