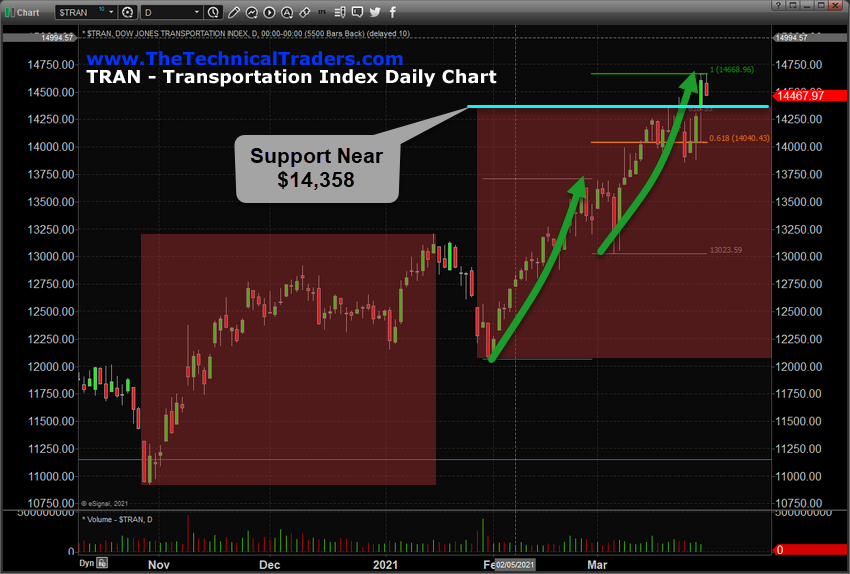
An interesting Fibonacci Measured Move pattern has set up in the Transportation Index (TRAN) recently. The Transportation Index is an important component of the future US economic expectations. As the Transportation Index rises, one could assume greater economic activity is expected in the near-term 3 to 6+ future months. As the Transportation Index declines, one could assume weaker economic activity is expected in the near-term 3 to 6+ future months. My research team and I watch the TRAN as a type of confirming indicator for US major index and sector trends. When we see the TRAN rising sharply, we can often assume various US sector trends will also move higher.
The Transportation Index Daily chart below shows two key elements we find interesting. The first RED price range on this chart represents a 100% Fibonacci Measured Price move from the early November 2020 bottom to the mid-January 2021 peak. If we extend that same range to the early February lows, we see a major support level exists near $14,358 (a full 100% Fibonacci Measured Price move). The TRAN price has recently broken above this level and we believe this support level will likely hold and prompt another moderate rally attempt above $14,750.

Another Fibonacci 100% Measured Price move can be seen in the second RED box, originating at the start of February 2021 lows and peaking at near the late February highs. We have drawn this Fibonacci Extension range on this chart showing the $14,669 level as the 100% Measured Move target. The high price for today, at $14,669.02, reached this 100% Fibonacci Measured Price level and has begun to pull back a bit. This is an expected type of price reaction to a 100% Measured Move event before a new price trend starts up again.
We believe the support near $14,358 will hold up well throughout this brief pullback in price after reaching the $14,669 level. The recent rally in the Transportation Index, after the FOMC chatter, suggests the markets are still expecting a stronger global economic recovery attempt and that suggests the Transportation Index will likely attempt to move upward.
Watch for an upward breakout on the TRAN Daily chart above $14,700 and watch for new target levels near $15,000 and $15,625. We need to let the markets work through a moderate price rotation after reaching this fully 100% Measured Move advancement and to initiate a new price trend. It is very likely that once the TRAN breaks above $14,700, a new upside price trend in the US major indexes and strongest sectors will propel the US stock market higher by another 3.5% to 7.5% before reaching the next 100% Fibonacci Measured Price move levels.
