As the stock market tries to gain traction after recently pulling back, a bit of caution may be a good idea.
Breakout stocks are still holding up well for us, but breakouts have a higher failure rate when the major indices are in correction mode.
As such, we’ve been expanding our radar to hone in on bullish trend-reversal setups as well.
One such swing trade setup is iShares Biotech ETF (NASDAQ:IBB), which has been on our internal stock pick watchlist for potential buy entry.
iShares NASDAQ Biotech ETF
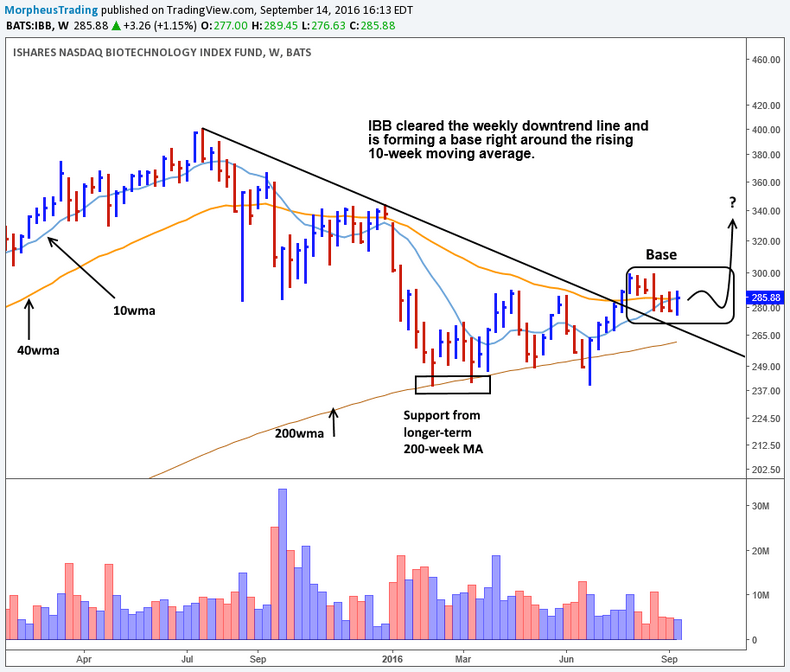
IBB's annotated weekly chart below shows the bullish trend reversal setup (my technical analysis of the setup follows):

After finding long-term support at the rising 200-week moving average (200-week MA) earlier this year, Biotech ETF rallied above resistance of a year-long downtrend line in late July.
That move also correlated to a breakout above the 40-week MA (similar to the 200-day MA).
Note the big bullish reversal candle in early July that sparked a five-week rally off the lows.
Healthy Correction
IBB pulled back after bumping into the $300 mark, but has since been building a solid base of support, above the 40-week MA, for the past six weeks.
The base of consolidation that followed the 5-week rally is bullish, especially considering the ETF only retraced about 1/3 of its recent gains.
Now, IBB has found a new, higher level of support.
Bullish Confirmation
Confirming the bullish picture is the 10-week MA, which is now in a clear uptrend and recently crossed above the 40-week MA.
That crossover is a bullish signal of intermediate-term trend reversal as well.
The longer-term 40-week MA is still trending lower, but has flattened out quite a bit.
The Play
In the coming days, look for IBB to start rallying off its 40-week MA support, which should lead to new swing highs above the $300 level.
A protective stop could be neatly placed below the low of the past four-weeks of support ($274 area gives it some “wiggle room”).
Why PayPal May Pay Off
We continue to build our watchlist as the market settles in after last week’s selloff.
SIMO, GIMO, GDDY, PYPL are just a few candidates from our Wagner Daily buy watchlist.
Of these, we particularly like PYPL and the chart below shows why it may be back in play with bullish momentum.
It’s Relatively Simple
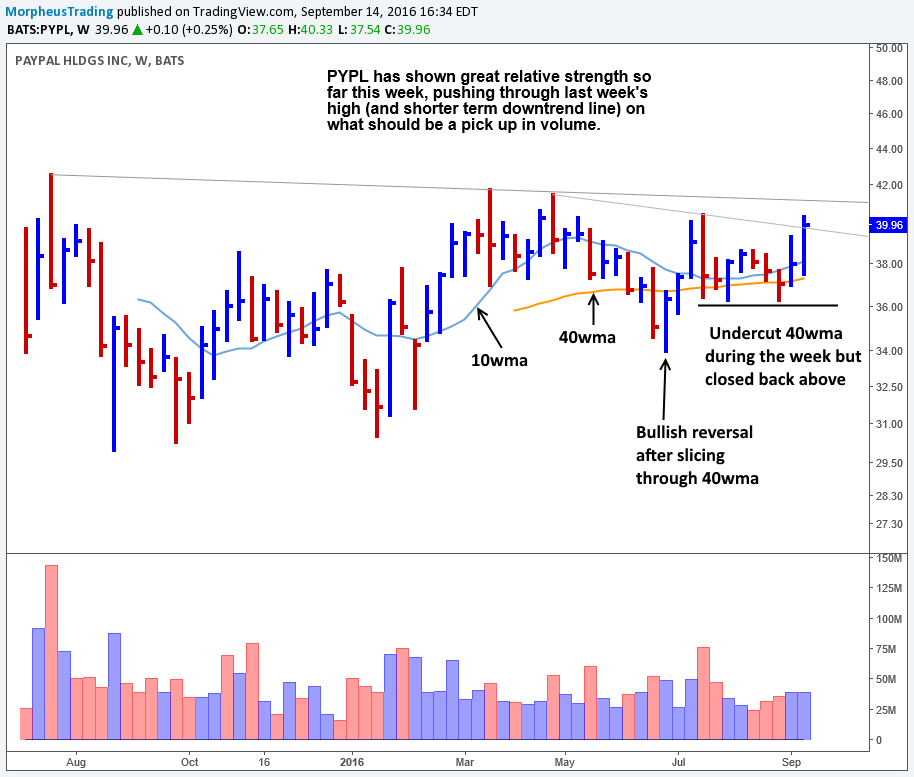
PYPL has shown great relative strength this week, after basing out above the 40-week MA for roughly six weeks in July and August.
While most stocks have sold off since last Friday, PYPL broke through last week’s high on a pick up in volume.
If a stock is so strong that it moves higher while the broad market sells off, that’s the power of relative strength!
Relative strength enables a stock to rocket higher when the broad market starts moving higher; these are my favorite types of stocks to buy.
Check out the relative strength on the weekly chart of PYPL below:

In addition to the relative strength, both the 10 and 40-week MAs have been trending higher for the past several weeks.
The Play
There is quite a bit of resistance in the $40 – $41 area, which may or may not take some time to work through depending on market conditions.
There is also the possibility that the price remains in a tight range until earnings in late October.
But if PayPal breaks out to a new 52-week high (above the $41 area), substantial trading profits may be made on this momentum trade.
Of course, it would be a good plan to keep a stop a few percent below the breakout level, just to cut the losses quickly if the breakout fails.
Whether or not such a breakout succeeds will largely be determined by the strength of the overall broad market, which is driven by leading stocks.
Either way, IBB carries quite a favorable reward-risk ratio, and PYPL sure isn’t bad either.
