Get 40% Off
💰 Buffett reveals a $6.7B stake in Chubb. Copy the full portfolio for FREE with InvestingPro’s Stock Ideas toolCopy Portfolio

Stocks Melt Higher As Convexity Gets Squeezed

Published 10/13/2020, 01:14 AM
Updated 09/20/2023, 06:34 AM
NDX
-
QQQ
-
AAPL
-
NFLX
-
AVGO
-
U
-

Stocks had a massive move higher yesterday, and really to no surprise. It was Monday; this happens every Monday. Yesterday’s move higher felt like a massive short-squeeze of sorts; I think it had more to do with a convexity squeeze more so. It is the same concept as a short-squeeze but instead is when dealers have to get long more stock to stay gamma neutral, due to their options books. Factor in, that the higher the stocks go, the more call buying it attracts, and the cycle gets out of control.
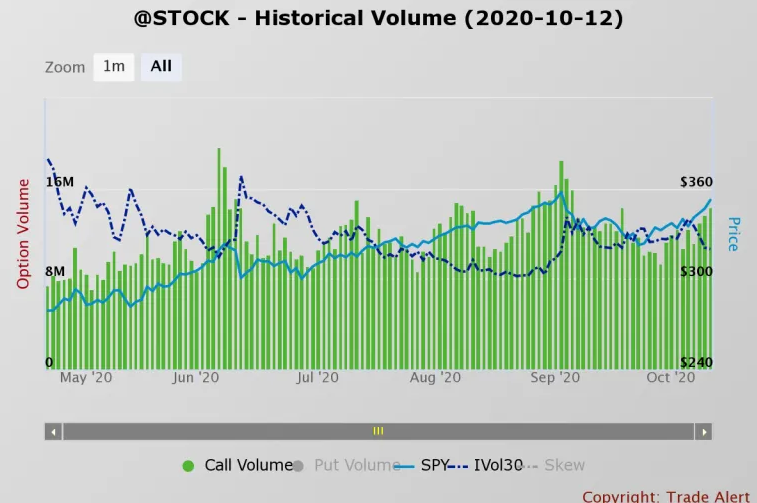
Stock Historical Volume

Not only that, but remember, we had one of the biggest short positions being built up the non-commercials of the NASDAQ 100. It seems like these they were also getting squeezed and starting to cover. We can also see that dealers have been building their positions in the NASDAQ 100, which suggests hedging is taking place, either against stocks or indexes. It supports the convexity squeeze narrative.
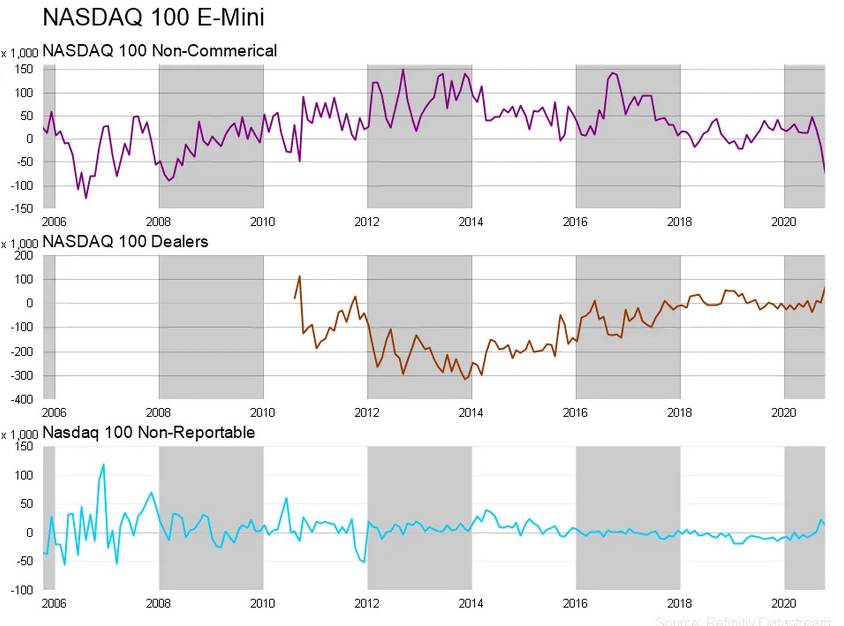
Nasdaq 100 E-Mini Chart

It doesn’t invalidate yesterday’s move at all; it is just important to understand what is happening because it can likely continue until something snaps. We also know that this wasn’t a stimulus play because the sectors that would benefit from a stimulus did not have nearly as strong of a day.

The key to all of this will be watching the implied volatility levels, when dealers start cranking those levels up, the snap will come, just like as in June and September.

NASDAQ 100 (QQQ)

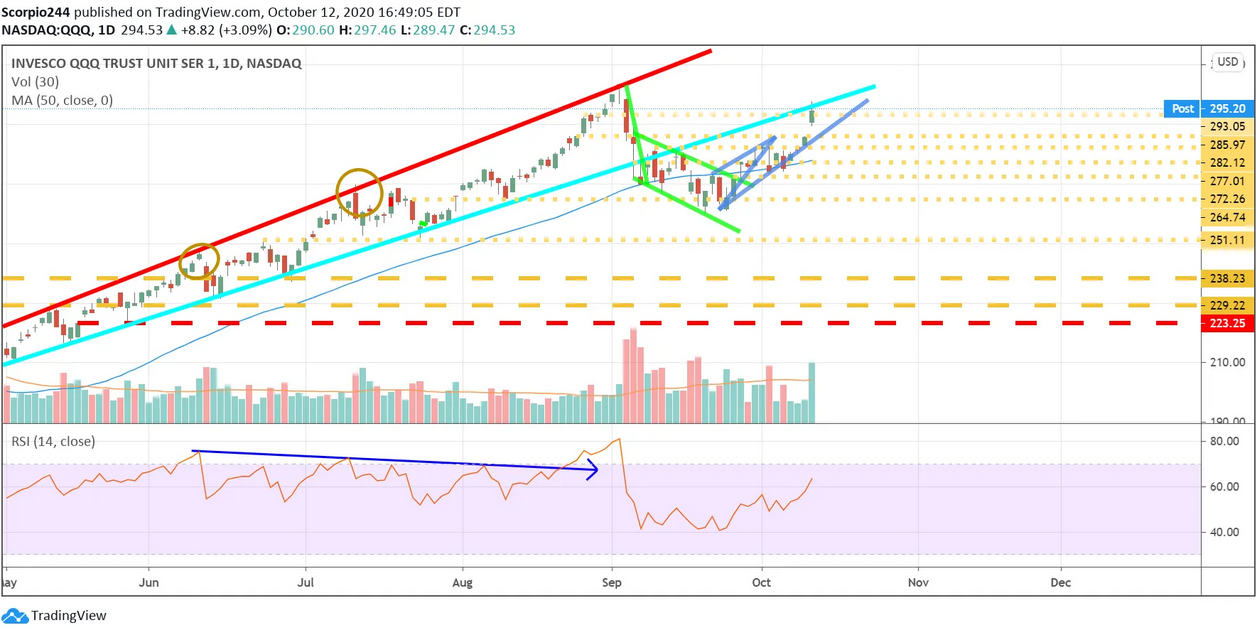
The Qs cut right through resistance at $293 and instead move up to $297. They paused when they go to the uptrend, and for now, the biggest obstacle for the Qs maybe that uptrend, which should now be resistance. The RSI and volume explosion suggests higher prices lie and I still think we head back to the highs.
3rd party Ad. Not an offer or recommendation by Investing.com. See disclosure here or remove ads .

QQQ Daily Chart

Apple

Apple (NASDAQ:AAPL) went up over 6% yesterday, which is just ridiculous for a stock of its size. It pretty much stalled out at $124, which was the resistance level we pegged starting on Friday. The next stop is likely $131.
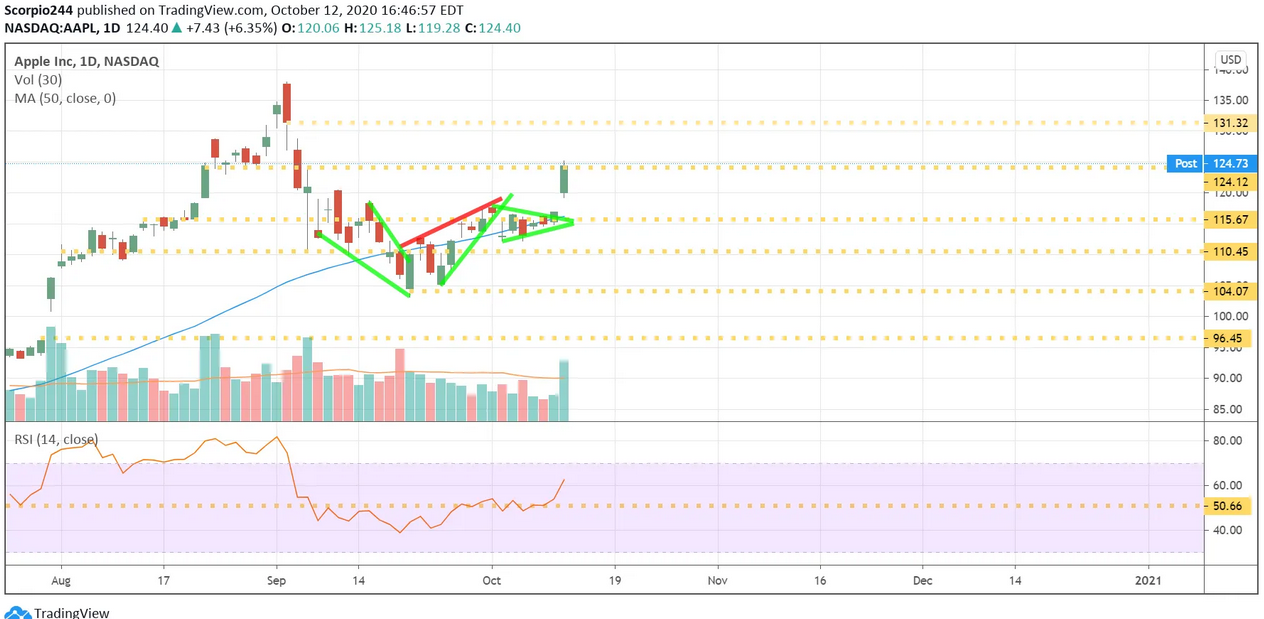
Apple Inc Daily Chart

Broadcom

Broadcom (NASDAQ:AVGO) finally broke above resistance yesterday, and that RSI shows you how much momentum is moving in the equity. A projection suggests the stock climbs to $399.
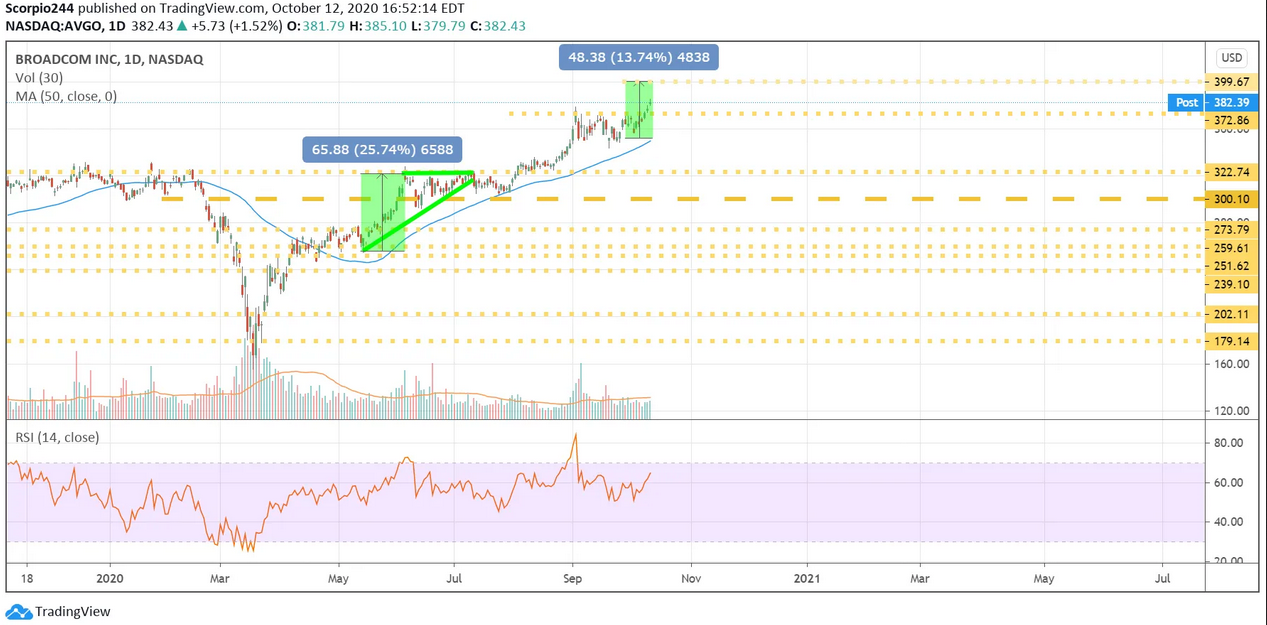
Broadcom Inc Daily Chart

Unity Software

Unity Software Inc (NYSE:U) was crushed yesterday, falling by 10%. It sounds like competitor Roblox is coming to the market. The one thing I know is that my kids love Roblox more than they ever loved Netflix (NASDAQ:NFLX). In fact, Roblox has replaced their YouTube and Netflix time.
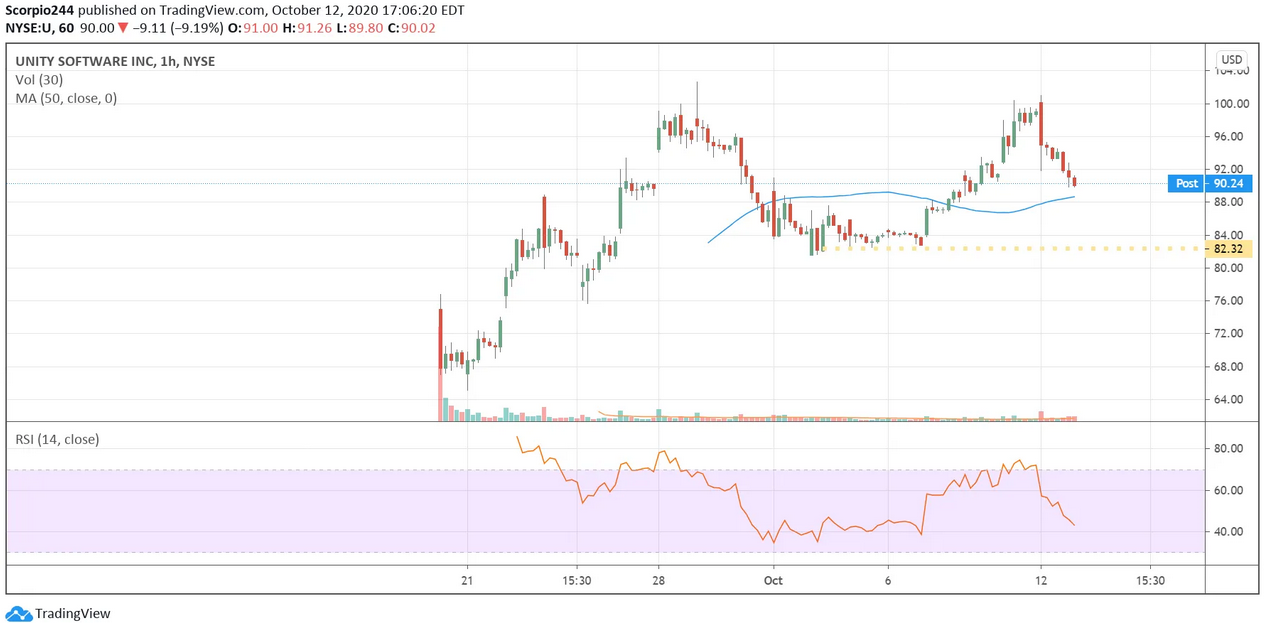
Unity Software Inc Hourly Chart

See you tomorrow.

Original Post

Latest comments

Thank you for all your efforts and hard work.
previous: escape taxes
thanks for insigths, may I write: fundamentals, stimulus coming, Apple, Amazon "events" soon, Faang escape taes "news"
Risk Disclosure: Trading in financial instruments and/or cryptocurrencies involves high risks including the risk of losing some, or all, of your investment amount, and may not be suitable for all investors. Prices of cryptocurrencies are extremely volatile and may be affected by external factors such as financial, regulatory or political events. Trading on margin increases the financial risks.
Before deciding to trade in financial instrument or cryptocurrencies you should be fully informed of the risks and costs associated with trading the financial markets, carefully consider your investment objectives, level of experience, and risk appetite, and seek professional advice where needed.
Fusion Media would like to remind you that the data contained in this website is not necessarily real-time nor accurate. The data and prices on the website are not necessarily provided by any market or exchange, but may be provided by market makers, and so prices may not be accurate and may differ from the actual price at any given market, meaning prices are indicative and not appropriate for trading purposes. Fusion Media and any provider of the data contained in this website will not accept liability for any loss or damage as a result of your trading, or your reliance on the information contained within this website.
It is prohibited to use, store, reproduce, display, modify, transmit or distribute the data contained in this website without the explicit prior written permission of Fusion Media and/or the data provider. All intellectual property rights are reserved by the providers and/or the exchange providing the data contained in this website.
Fusion Media may be compensated by the advertisers that appear on the website, based on your interaction with the advertisements or advertisers.
© 2007-2024 - Fusion Media Limited. All Rights Reserved.