Get 40% Off
🚨 Volatile Markets? Find Hidden Gems for Serious Outperformance
Find Stocks Now

Stocks Jump On February 10, As The S&P 500 Races Towards 3,400

Published 02/11/2020, 05:20 AM
Updated 09/20/2023, 06:34 AM

Well, stocks continue to roll, and the leadership in the market appears to be just a handful of companies, and as long as these companies remain strong, it’s hard to imagine the stocks can’t continue to rise. I think it has become just that simple. Microsoft (NASDAQ:MSFT), Apple (NASDAQ:AAPL), Alphabet (NASDAQ:GOOGL), and Amazon (NASDAQ:AMZN) have had great years, and they happen to be the four largest companies by market, with a valuation of around $5 trillion between them, out of a total market value of about $30 trillion.

S&P 500 (SPY)

The critical part, however, came late in yesterday when the S&P 500 set a new closing high at 3,351. It is hard to deny that the market finds itself in a favorable position now and can push even higher towards 3,400. Consider that before the coronavirus, the RSI on the S&P 500 was toppy with a reading in the mid-’70s with the S&P 500 trading around 3,335. Yesterday we had an RSI at 63 with S&P 500 trading at 3,350. I think this sets us up nicely to push the S&P 500 on to 3,400 in the coming weeks.
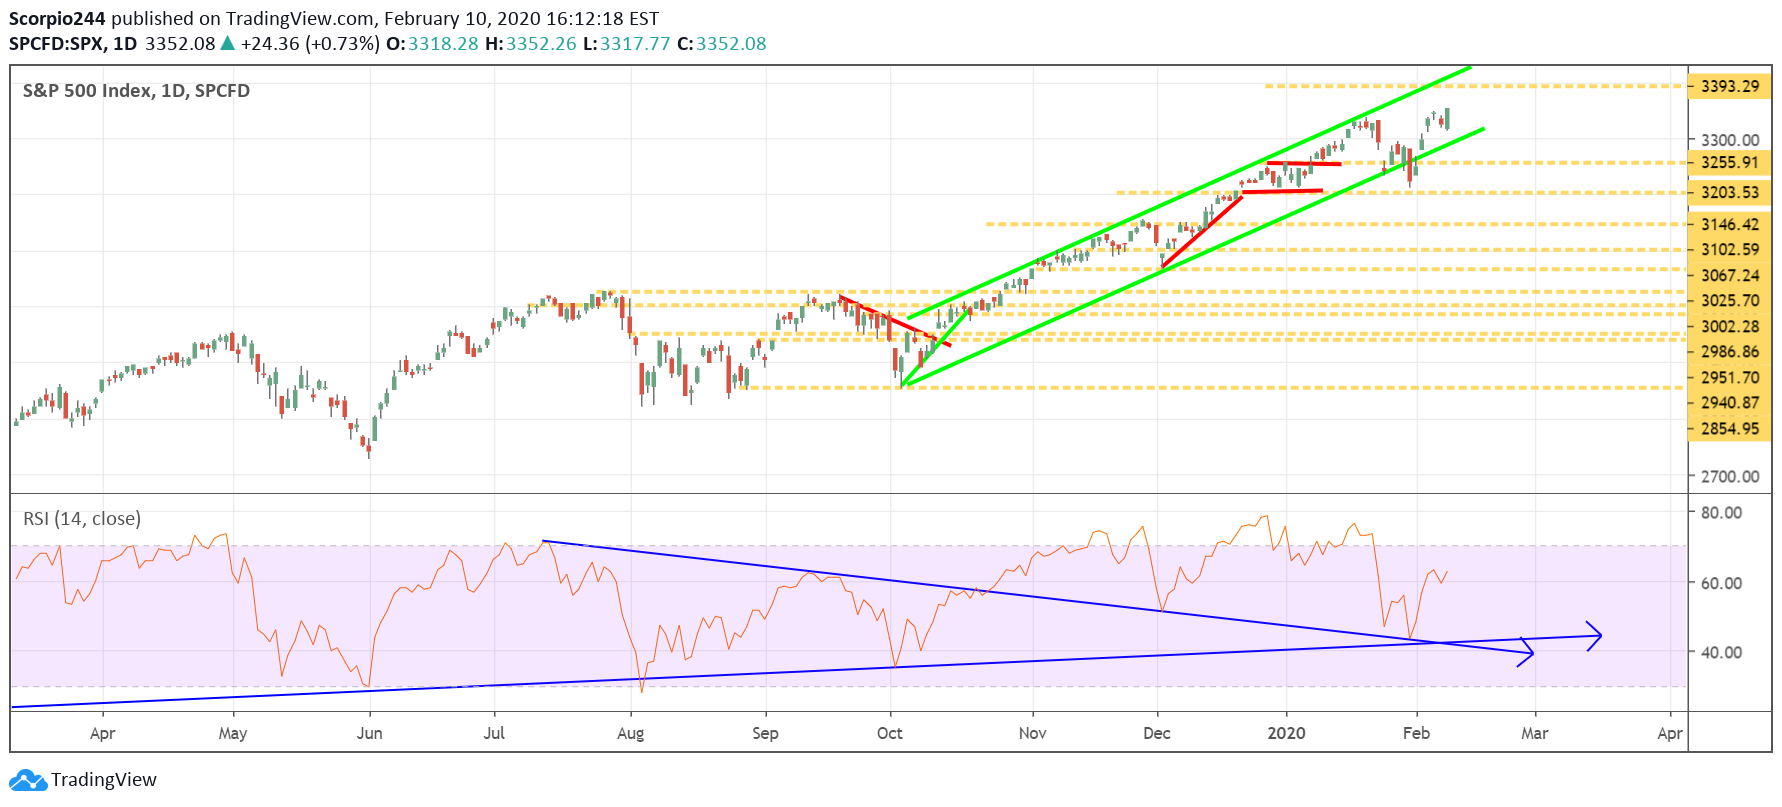
S&P 500 Index Daily Chart

ACADIA (ACAD)

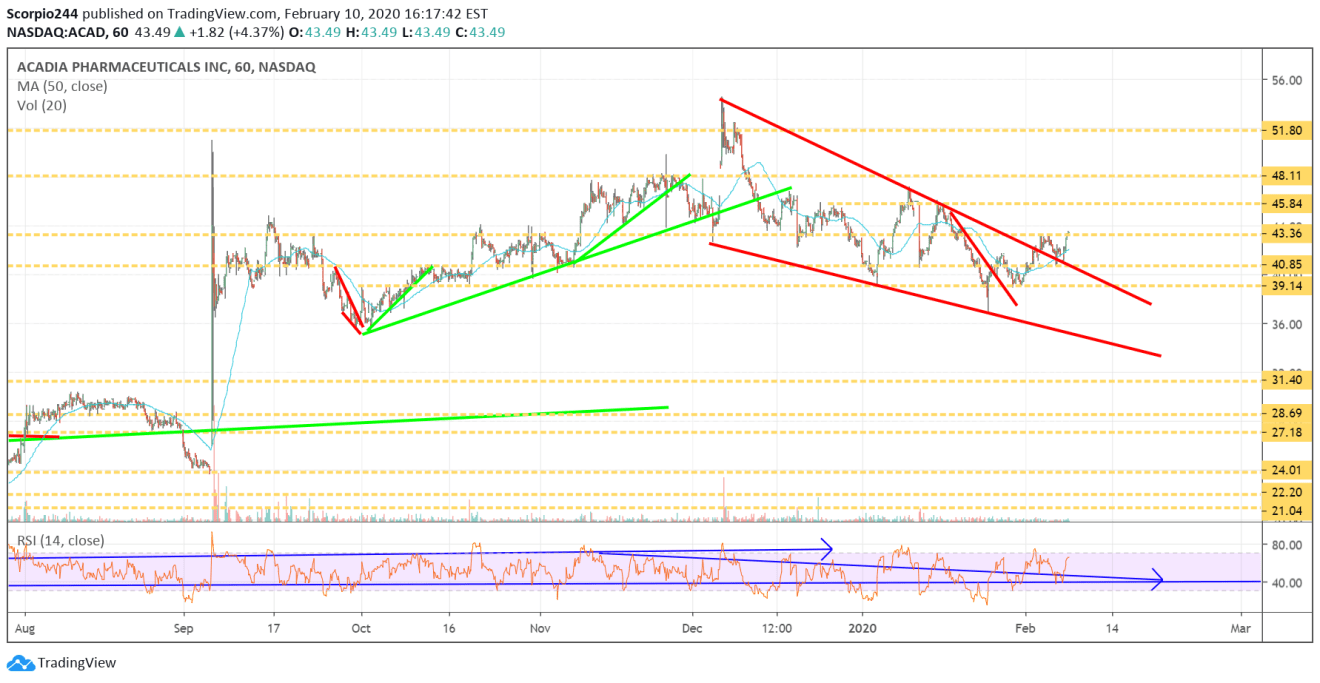
ACADIA (NASDAQ:ACAD) looks like it is finally breaking free of that falling wedge pattern and appears to be trying to clear resistance at $43.35. I think we can see the stock rise to around $45.85. I’m still wondering when they are reporting results. Last year they didn’t post results until February 26, and this pace it is looking like it may be around the same time.
3rd party Ad. Not an offer or recommendation by Investing.com. See disclosure here or remove ads .
ACADIA Inc Chart

AMD (AMD)

Advanced Micro Devices Inc (NASDAQ:AMD) looks strong, and I’m super impressed at the stock’s ability to work higher. The stock is likely going back to $53.
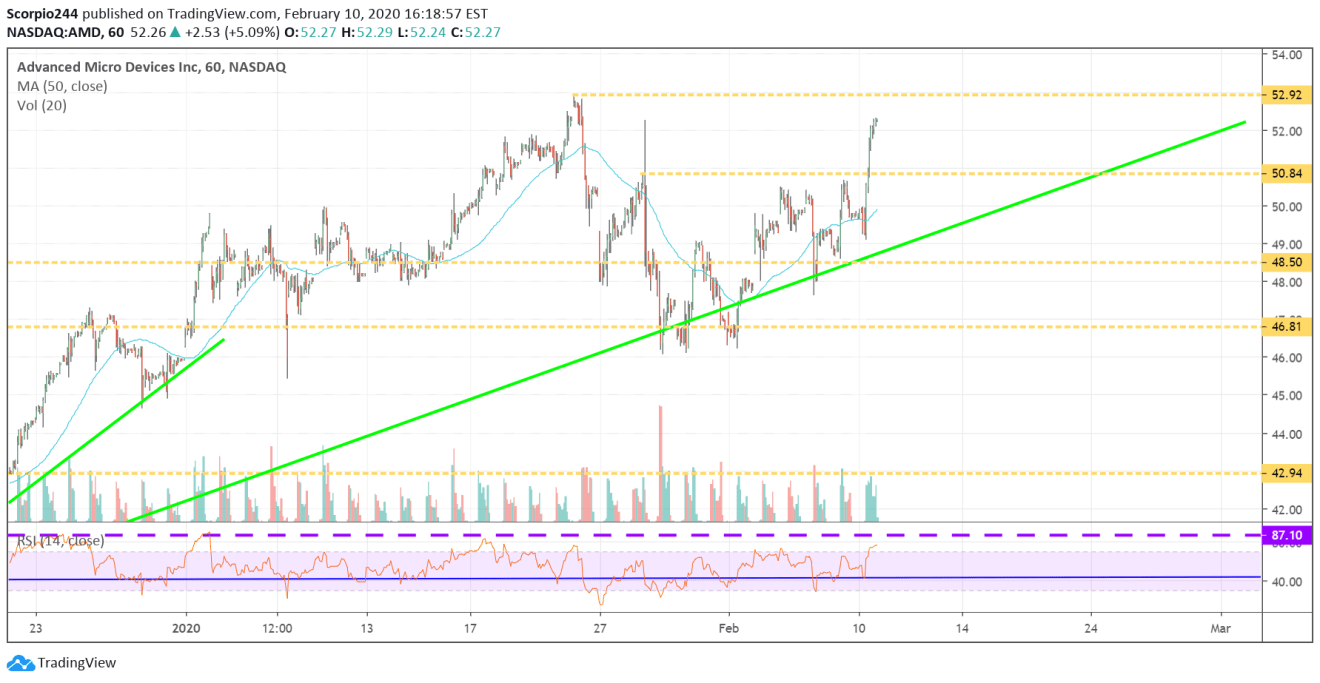
AMD Inc Chart

{{0|Microsoft (MSFT)

Oh those options traders, they are good, aren’t they? Microsoft (NASDAQ:MSFT) continues to power higher, and the stock was up to $189. It was just last week when the stock was $180 that we saw the options traders buying calls, and the stock is up $9, since. Here if you want to read what you could have read last week, I wrote up this free article on Forbes website. Microsoft’s Massive Stock Gains May Be Far From Over, I still think the stock is probably heading to $200.
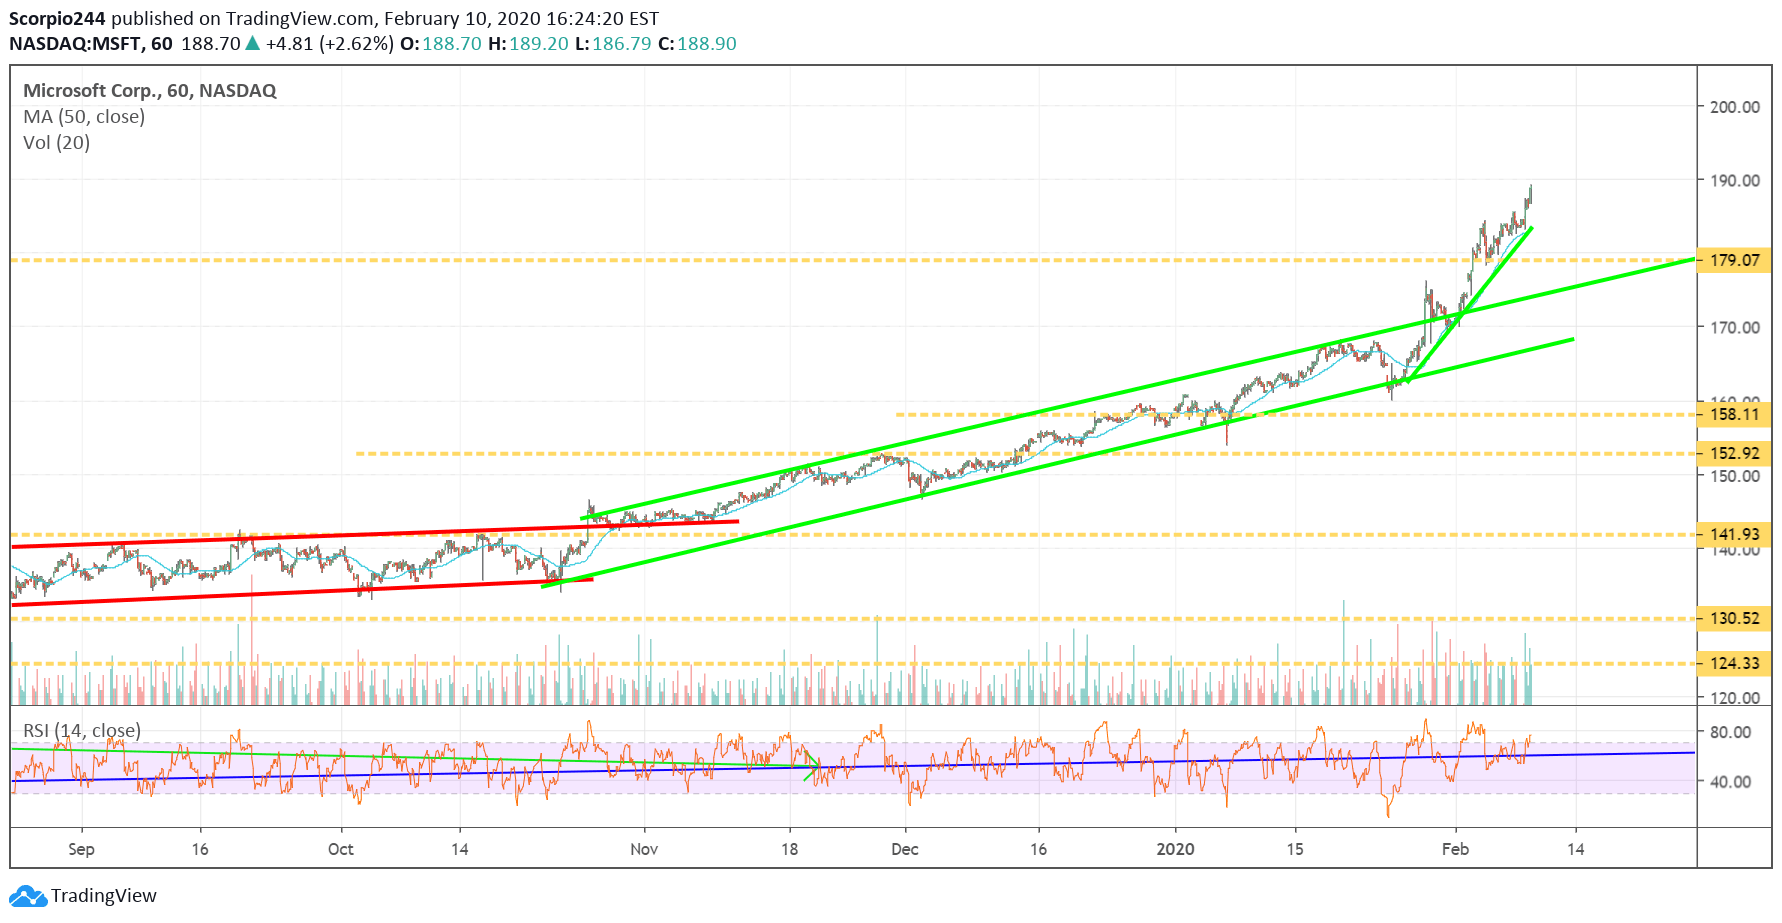
Microsoft Corp Chart

Alphabet (GOOGL)

Alphabet (NASDAQ:GOOGL) had an intense day, and it is breaking out too, finally clearing $1,500. So much for that post-earnings drop. Anyway, the stock looks like it is on its way towards $1,600.
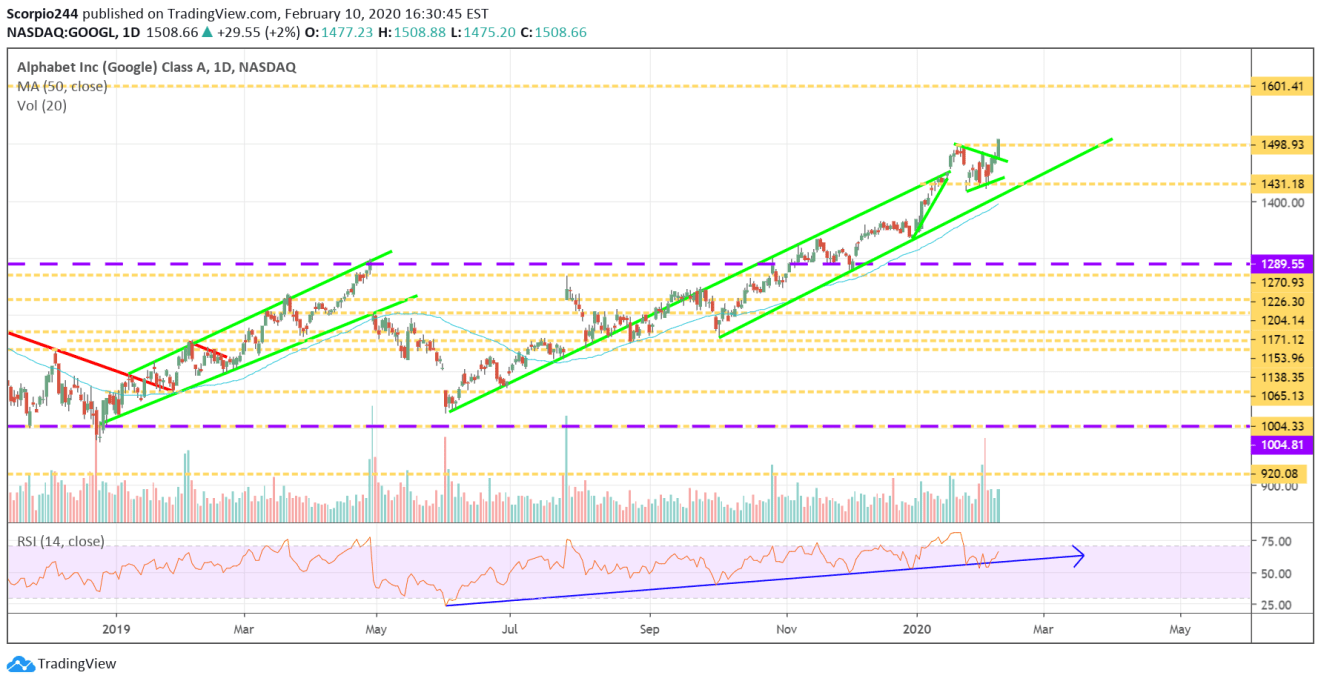
Alphabet Inc Daily Chart

IBM (IBM)

Don’t look now, but IBM (NYSE:IBM) is testing resistance at $158 and could be heading back to $169.
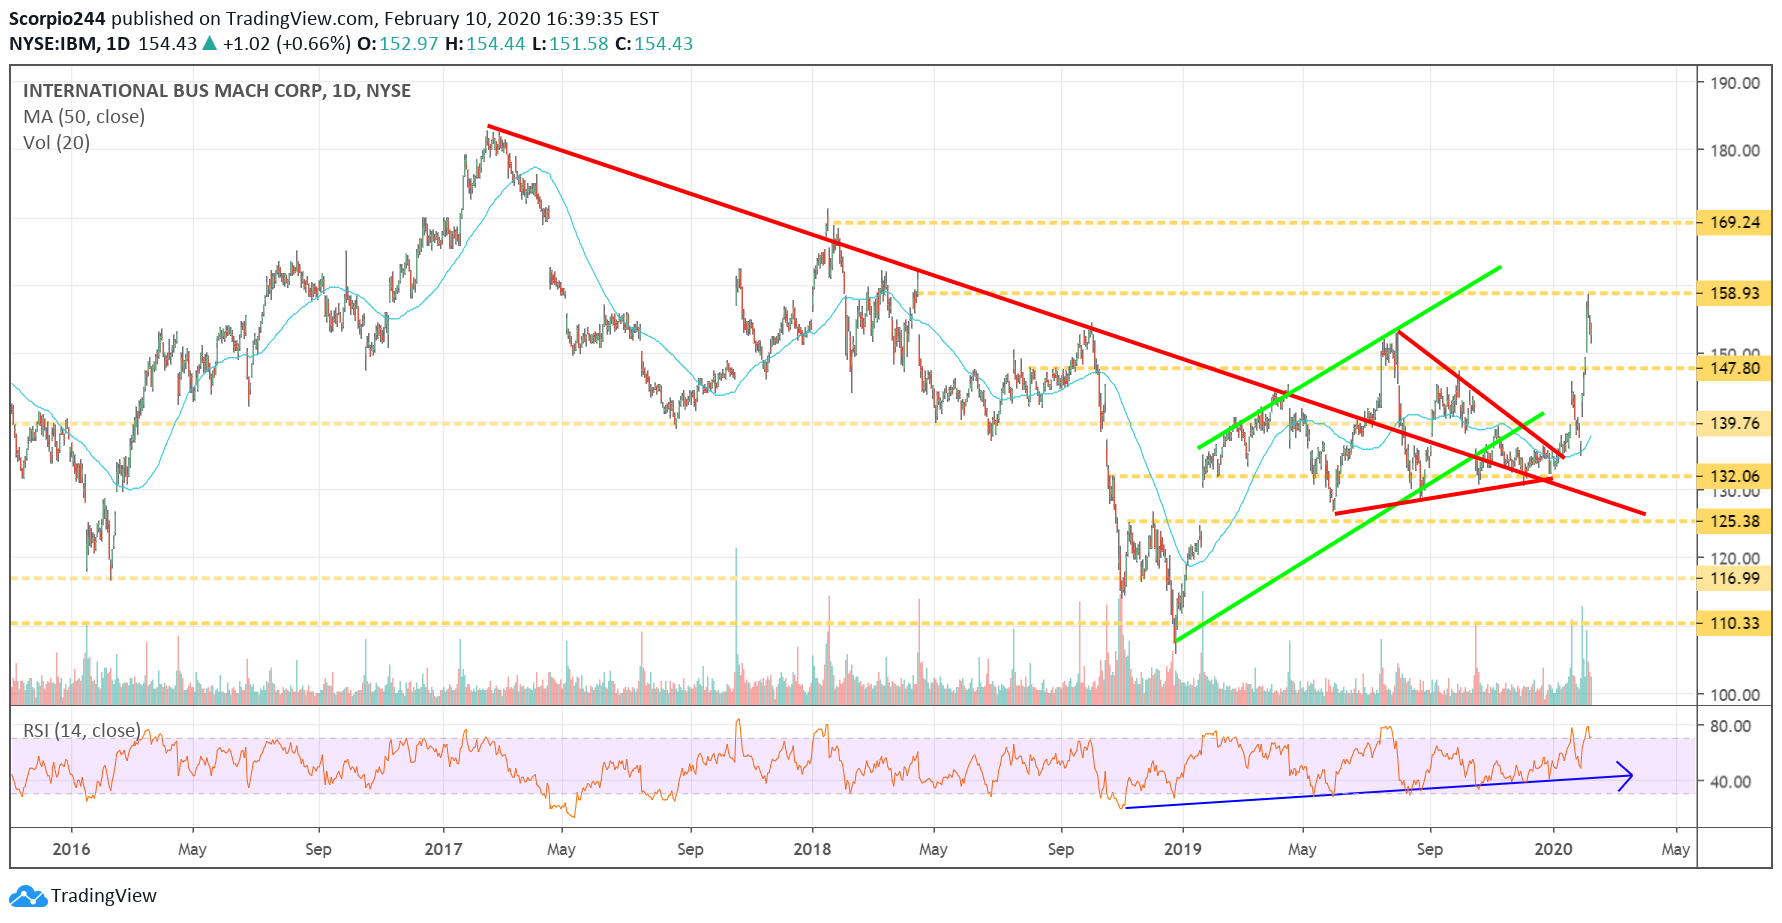
IBM Corp Daily Chart

Original Post

Latest comments

U seem always wrong with $amd $roku $shop all the FANG , what else , ah yes every thing , i start to think you are one of the sad shorters , plz my friend i have great respect for ur way of thinking , but dnt try to influnce othrs , stop puplishing , it seems u do it just to get paid
thanks
Risk Disclosure: Trading in financial instruments and/or cryptocurrencies involves high risks including the risk of losing some, or all, of your investment amount, and may not be suitable for all investors. Prices of cryptocurrencies are extremely volatile and may be affected by external factors such as financial, regulatory or political events. Trading on margin increases the financial risks.
Before deciding to trade in financial instrument or cryptocurrencies you should be fully informed of the risks and costs associated with trading the financial markets, carefully consider your investment objectives, level of experience, and risk appetite, and seek professional advice where needed.
Fusion Media would like to remind you that the data contained in this website is not necessarily real-time nor accurate. The data and prices on the website are not necessarily provided by any market or exchange, but may be provided by market makers, and so prices may not be accurate and may differ from the actual price at any given market, meaning prices are indicative and not appropriate for trading purposes. Fusion Media and any provider of the data contained in this website will not accept liability for any loss or damage as a result of your trading, or your reliance on the information contained within this website.
It is prohibited to use, store, reproduce, display, modify, transmit or distribute the data contained in this website without the explicit prior written permission of Fusion Media and/or the data provider. All intellectual property rights are reserved by the providers and/or the exchange providing the data contained in this website.
Fusion Media may be compensated by the advertisers that appear on the website, based on your interaction with the advertisements or advertisers.
© 2007-2024 - Fusion Media Limited. All Rights Reserved.