
Stocks sold off yesterday, but maintaining a bullish bias is still justified, and the market may have another opportunity to reach new highs. However, it’s crucial to pay close attention to the trading action, as there could be more uncertainty and volatility ahead.
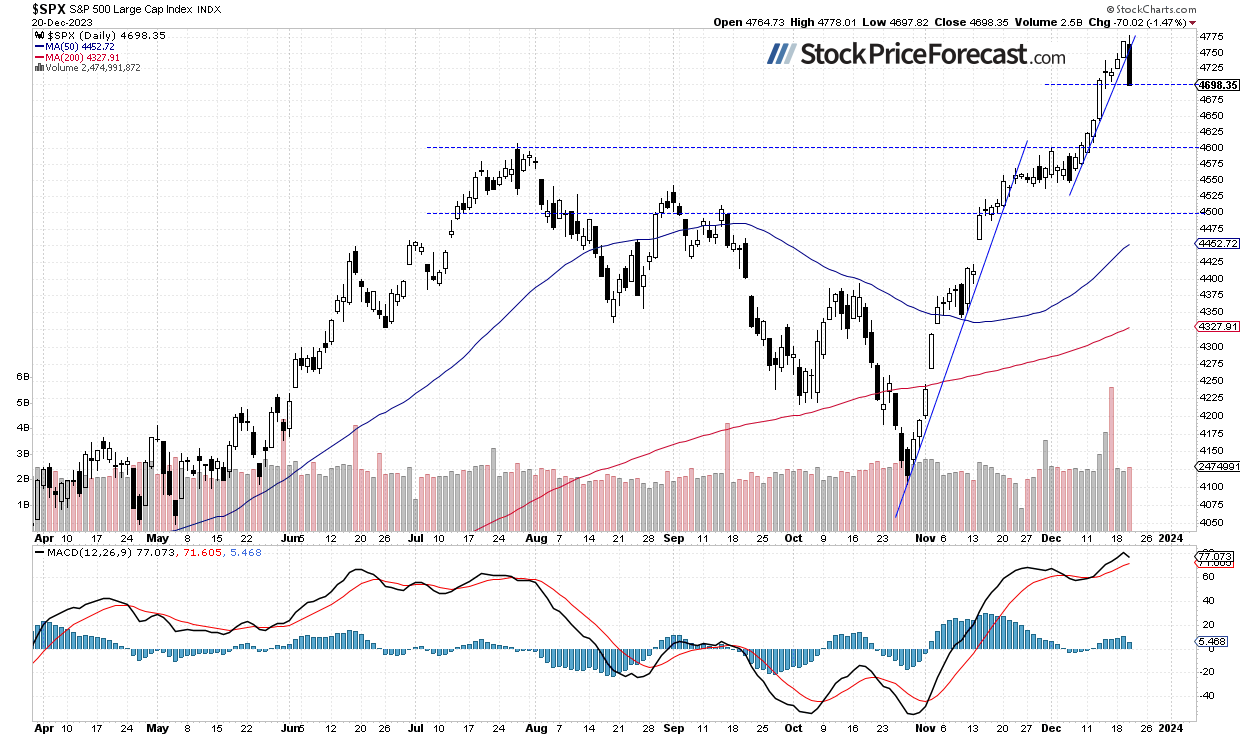
The S&P 500 index lost 1.47% on Wednesday, as it retraced its recent run-up following a quick profit-taking action in the middle of the day. The index reached new local high of 4,778.01 before going down to 4,700 level. The market was even closer to its Jan. 4 of 2022 all-time high level at 4,818.62 yesterday.
Recently it was extending the uptrend following last week’s release of the FOMC Statement release on Wednesday, which marked a pivot in the Fed’s monetary policy. In early December the S&P 500 broke above the late July local high of around 4,607 after resuming a rally from the local low of 4,103.78 on October 27.
Stocks are expected to open 0.7% higher today, so the S&P 500 will retrace a large part of its yesterday’s intraday sell-off this morning. For now it looks like a correction within an uptrend, as the market is still well above its local high from July. The likely scenario is a consolidation along 4,700-4800.
How can we capitalize on such trading action? It’s better to shorten the timeframe of the trades and look for buying opportunities at support levels and selling at resistance levels. The S&P 500 index broke below its steep upward trend line as we can see on the daily chart:
Futures Contract Rebounds Slightly
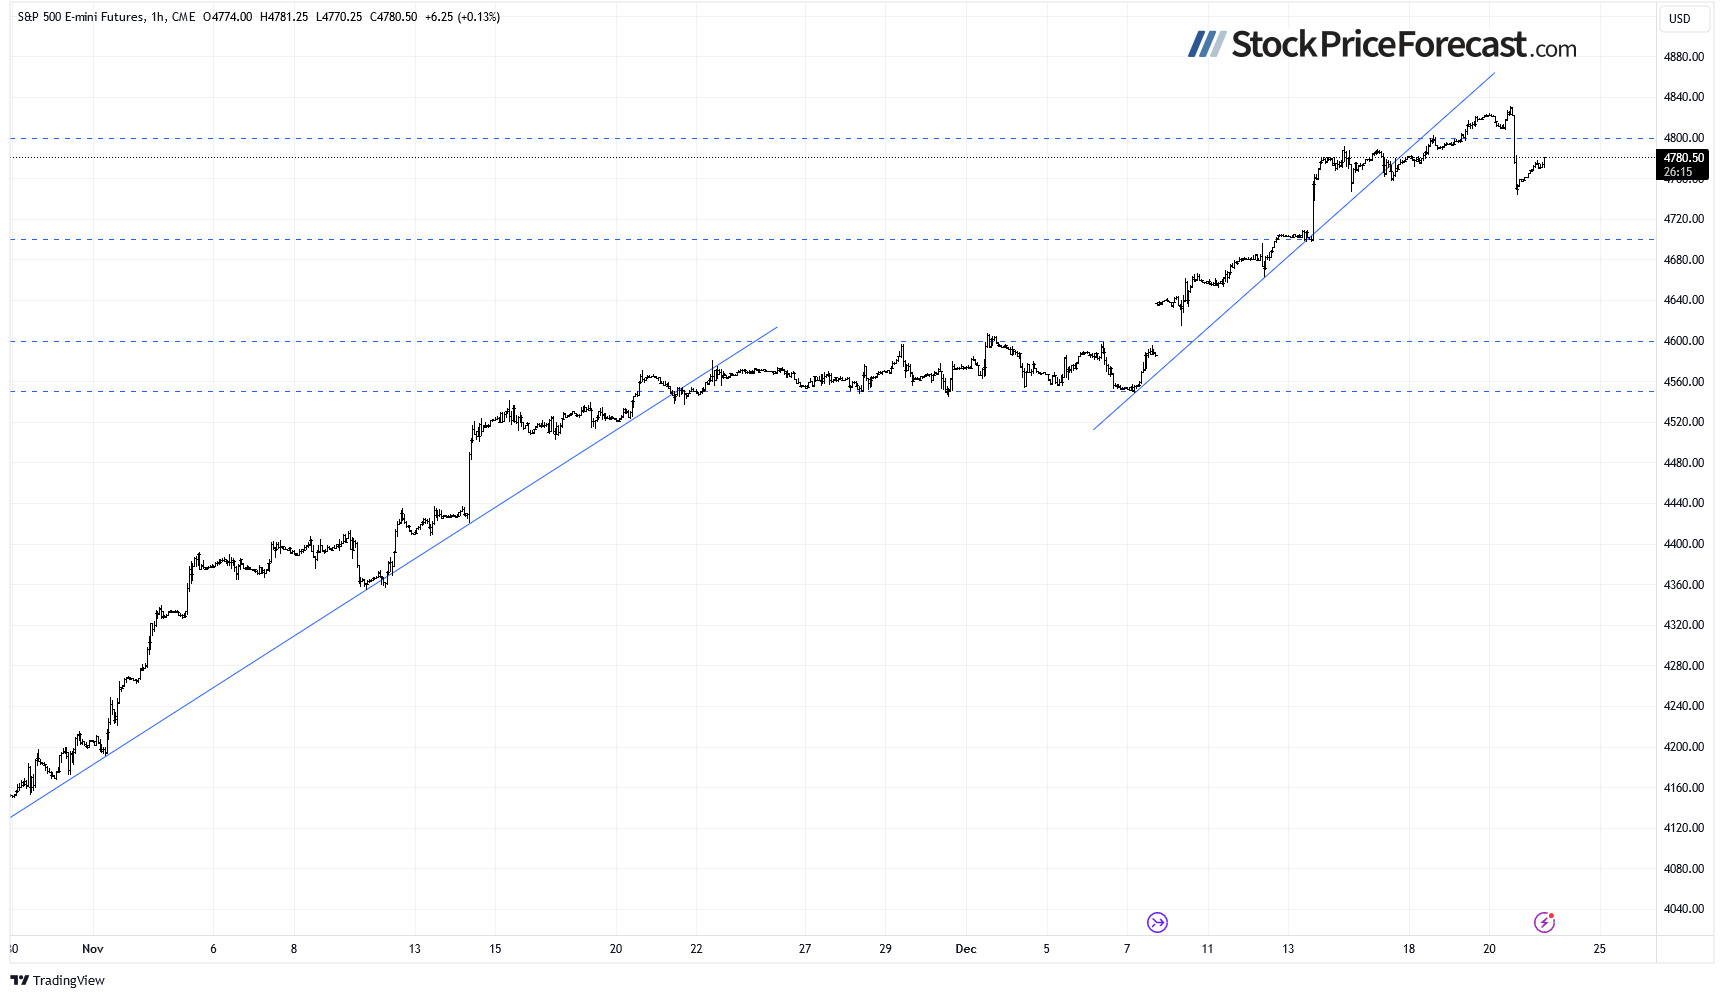
Let’s take a look at the hourly chart of the S&P 500 futures contract. It’s bouncing back after yesterday’s intraday sell-off. The support level is now at 4,750, marked by yesterday’s daily low of around 4,745. On the other hand, the resistance level is at 4,800-4,820.
Conclusion
The S&P 500 index retraced most of its recent advances yesterday, and this morning, it is likely to bounce by 0.7%. Yesterday I wrote that “There have been no confirmed negative signals so far, but the market may experience a downward correction at some point.”, and the market did correct its uptrend. But is it sufficient to turn bearish and close a profitable long position? There is still a chance of extending the uptrend, but in a short-term the market may see some more uncertainty and volatility.
The long position remains profitable and recently it added even more gains. Overall the index has gained 706 points since opening that trade at 3,992.4 on Feb. 27. In the near future, I will be looking to close that trade and shift focus to a more short-term oriented trading strategy. For now, it remains justified as stocks may further extend their uptrend.
Here’s the breakdown:
- The S&P 500 suffered an intraday correction yesterday, but it still remains relatively close to medium-term highs.
- Short-term uncertainty and volatility may favor trading based on support and resistance levels.
- In my opinion, the short-term outlook is still bullish.