Upcoming US Events for Today:- No significant economic events scheduled
Upcoming International Events for Today:
- Canadian Housing Starts for February will be released at 8:15am EST. The market expects 190.0K versus 180.1K previous.
The Markets
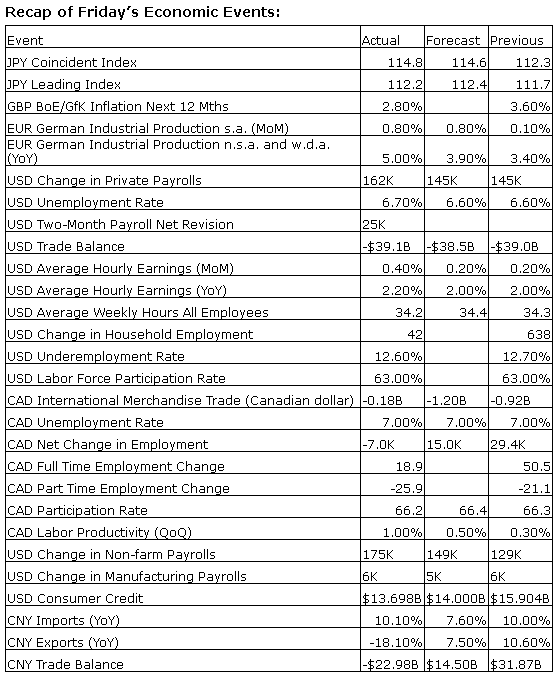
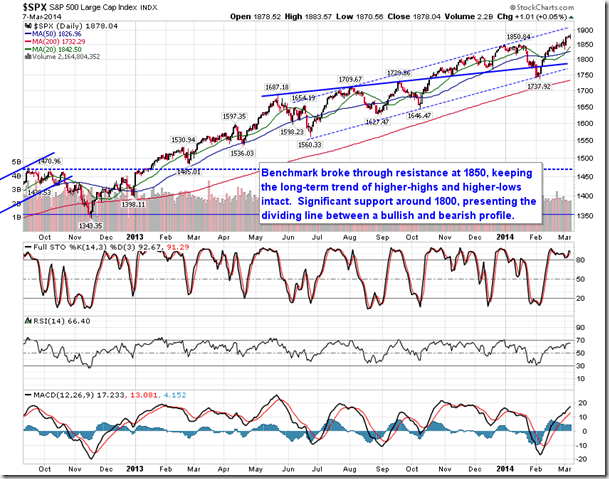
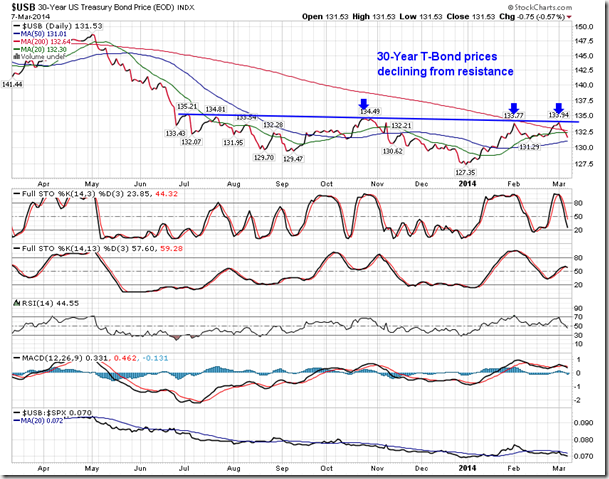
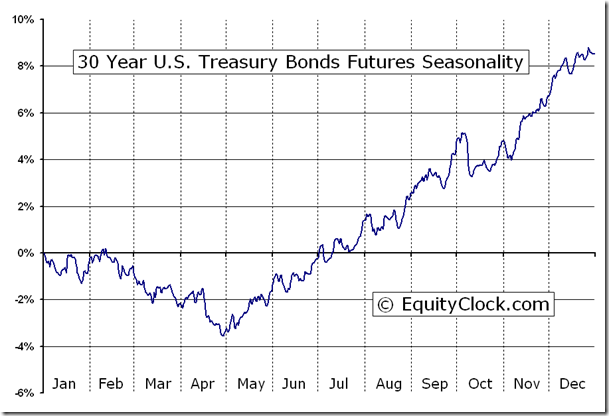
Stocks ended predominantly flat on Friday, despite a better than expected non-farm employment report for the month of February. According to the Bureau of Labor Statistics, 175,000 jobs were created in February, exceeding estimates calling for an increase of 149,000. The BLS noted that “severe winter weather occurred in much of the country during the February reference periods for the establishment and household surveys” suggesting that the reported result could have been even stronger in absence of the potential weather impact. The implied strength behind the employment data is expected to keep the Fed’s schedule to taper bond purchases intact as it seeks to unwind simulative policies. As a result, investors sold bonds during Friday’s session, pushing yields higher from recent levels of support. The Thirty-Year Treasury Bond Yield has bounced from a level of support around 3.5%, a level that has been tested during two other occasions over the past five months. Treasury bond prices are conversely declining from resistance. The long-term trend for bond prices continues to point lower, as derived from the direction of the 200-day moving average. The 20 and 50-day moving averages continue to point higher, suggesting further upside momentum over the short and intermediate term may still exist. Treasury bonds are seasonally weak between now and the end of April.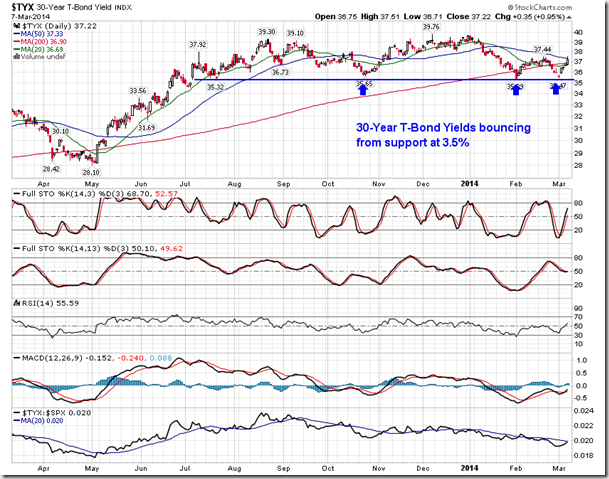
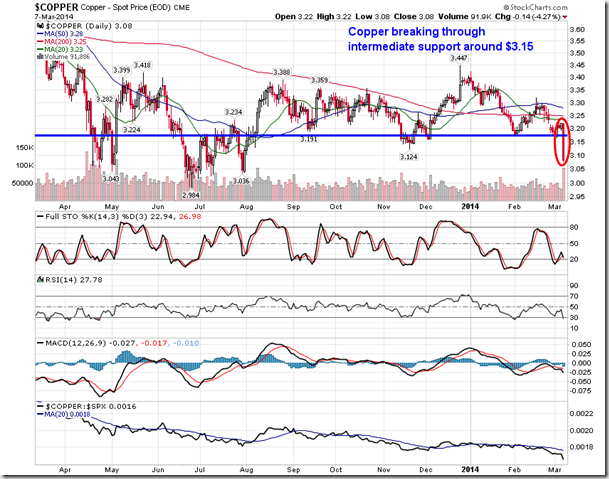
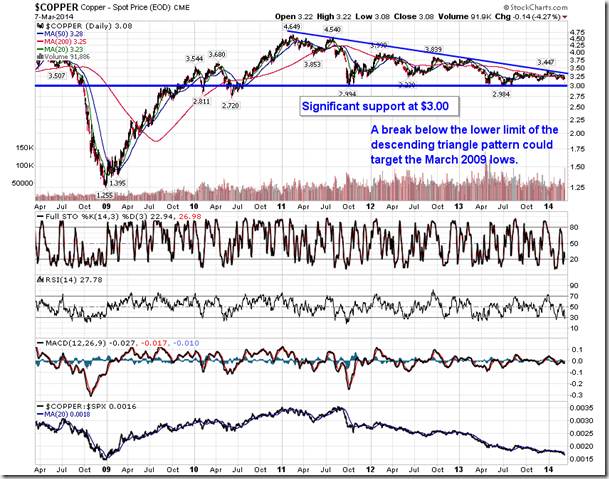
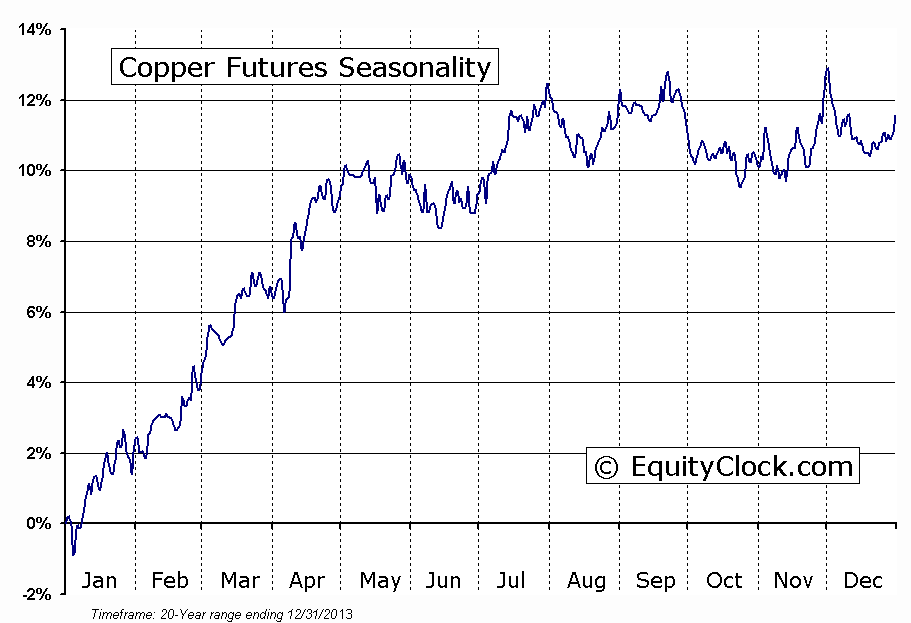
The more notable moves during Friday’s session were realized in the commodity market. Metal prices, including gold, silver, and copper, all traded firmly lower, in part due to the prospect of further Fed tapering and in part due to ongoing concerns pertaining to growth in China. Gold declined by 0.78, silver shed 2.72%, and copper plunged 4.27%. The price of copper broke an intermediate level of support around $3.15, quickly trading back to long term support near $3.00. Copper’s reaction to long-term support is critical.A break below $3.00 would complete a large-scale descending triangle pattern, the target of which could reach as far as the March 2009 lows. The resulting implications that this break could have on the health of the global economy could potentially be disastrous as investor battle with the growth prospects in China, which accounts for about 40% of the global consumption of the industrial metal. Copper prices are typically strong at this time of year, however, growth concerns have prevented the regular seasonal pattern from playing out, thus far.
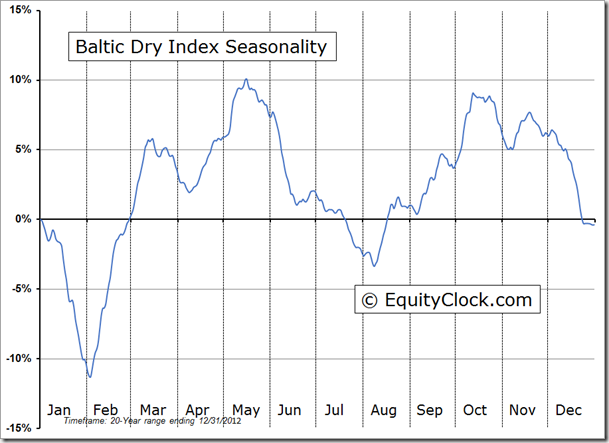
While the plunging price of copper is escalating growth concerns, the rebound in the Baltic Dry Index is providing some reason to be encouraged. The index, which provides an assessment of the price of moving major raw materials by sea, has been rebounding from around the upper limit of the previous long-term trading range, suggesting an improving trend. A rising trendline can be seen supporting the long-term trend. The implication of a rising Baltic Dry Index is that global economic fundamentals are improving, which would lead to stronger stock and commodity prices. The Baltic Dry Index seasonally rises between February and May, rebounding from the sharp declines typically realized in January leading up to the Chinese new Year.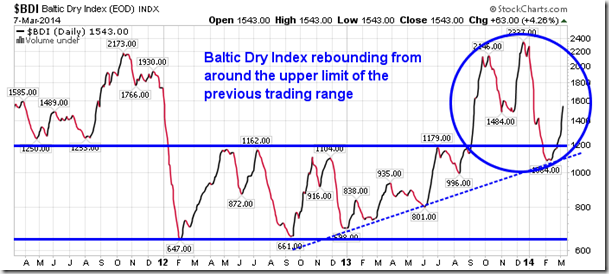
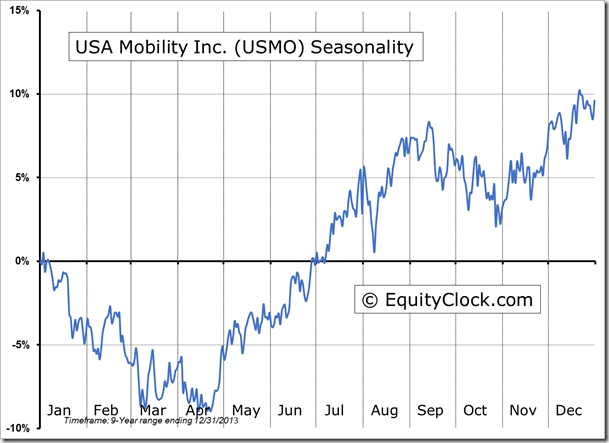
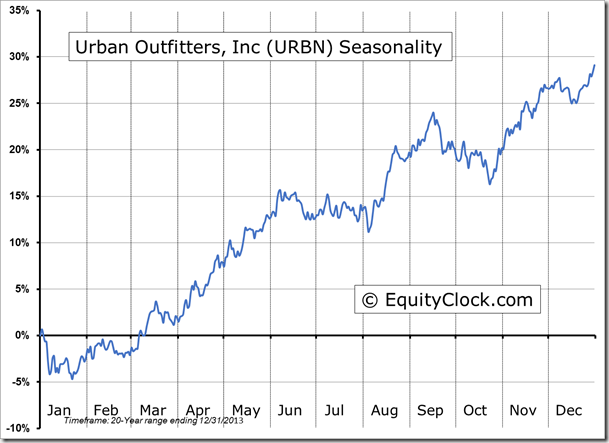
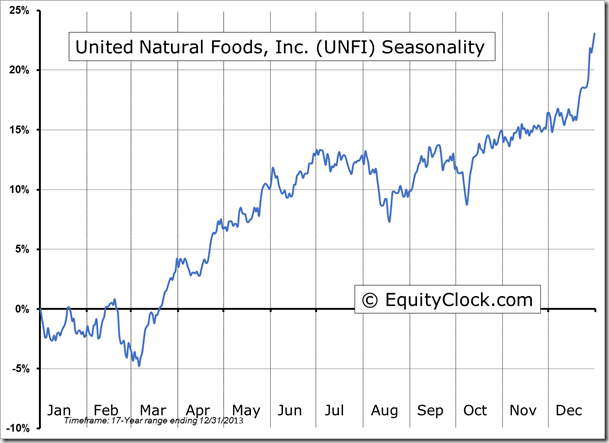
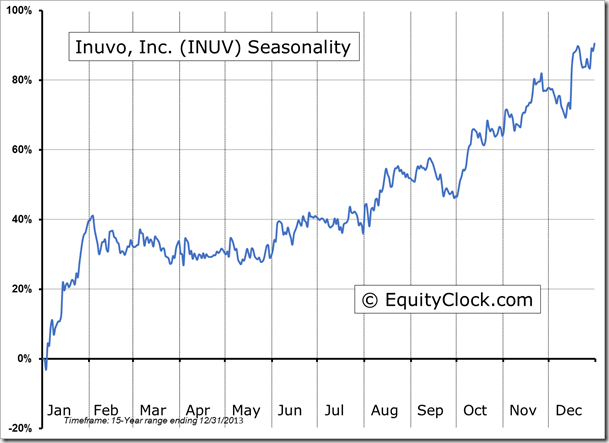
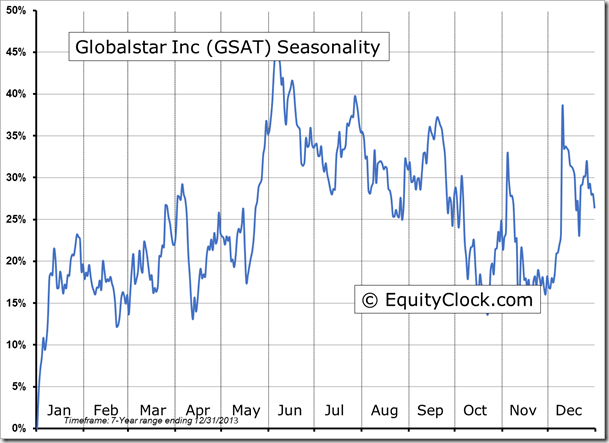
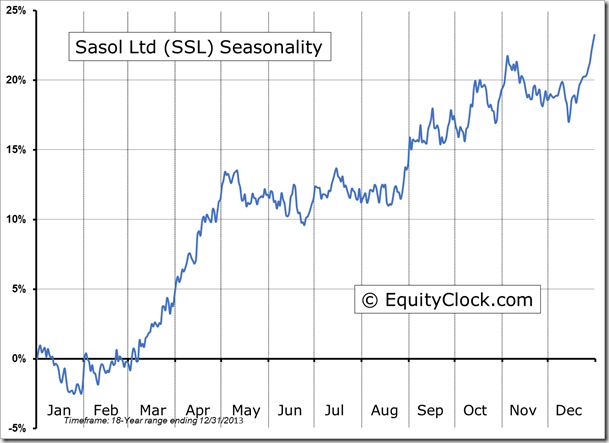
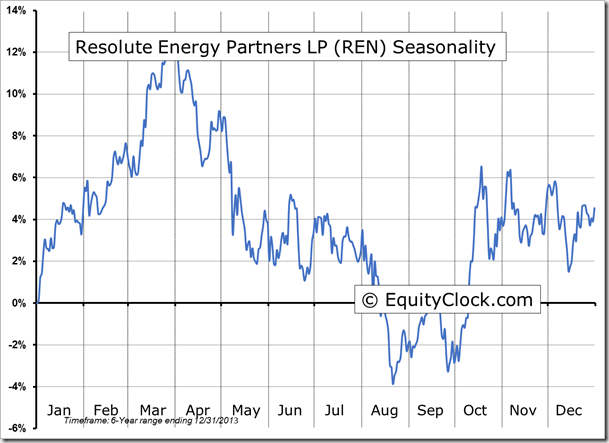
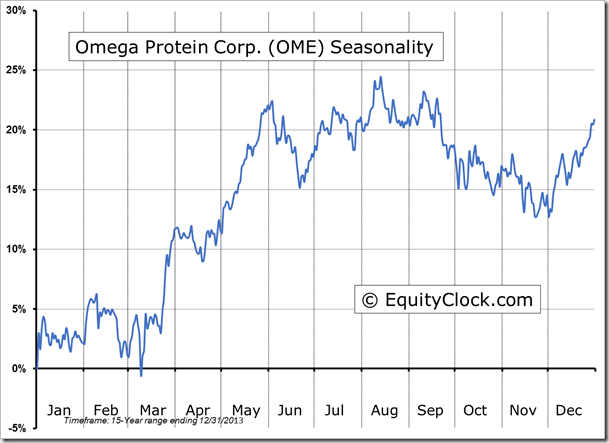
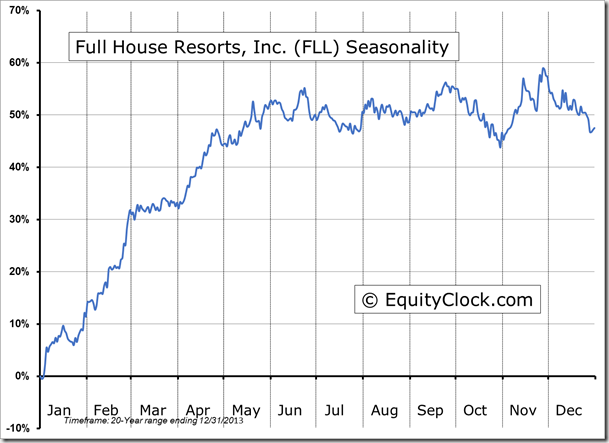
Seasonal charts of companies reporting earnings today:
Sentiment on Friday, as gauged by the put-call ratio, ended bullish at 0.82.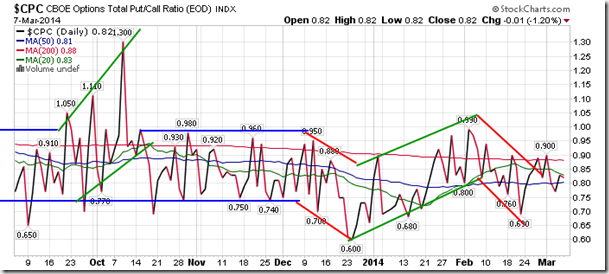
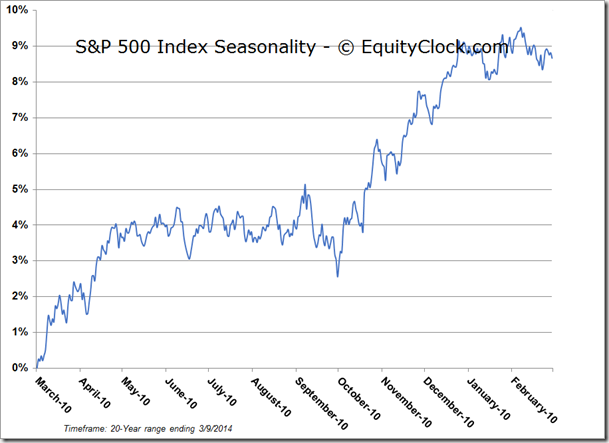
S&P 500 Index
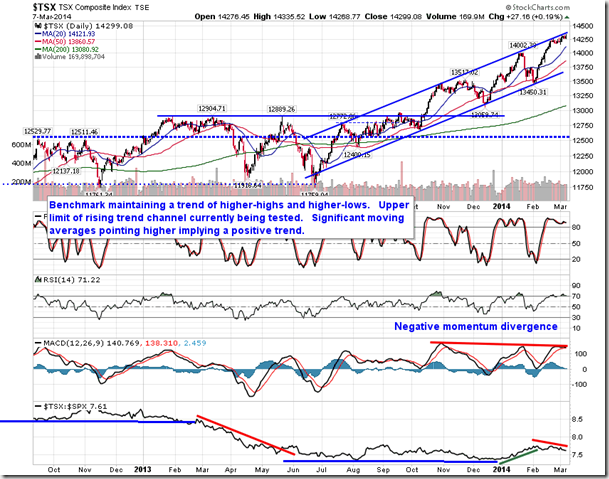
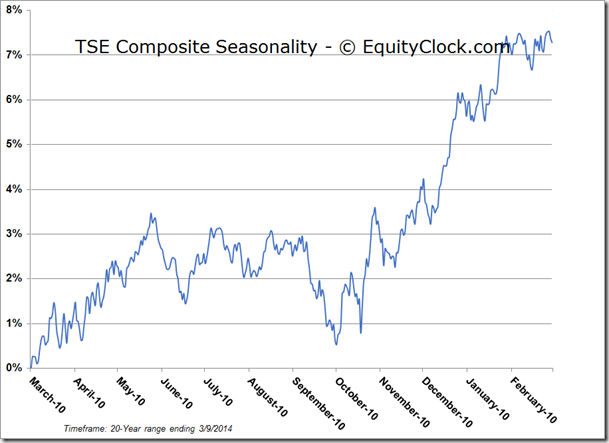
Horizons Seasonal Rotation ETF (TSX:HAC)
- Closing Market Value: $14.56 (down 0.14%)
- Closing NAV/Unit: $14.56 (up 0.04%)
Performance** performance calculated on Closing NAV/Unit as provided by custodian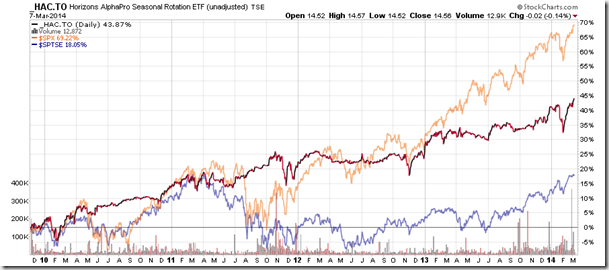
| 2014 Year-to-Date | Since Inception (Nov 19, 2009) | |
| HAC.TO | 1.82% | 45.6% |

