Get 40% Off
💰 Buffett reveals a $6.7B stake in Chubb. Copy the full portfolio for FREE with InvestingPro’s Stock Ideas toolCopy Portfolios

Stocks Continues To Charge Forward With Nothing To Stand In The Way

Published 02/20/2020, 06:15 AM
Updated 09/20/2023, 06:34 AM
US500
-
AMZN
-
XOM
-
AMD
-
CL
-
JD
-

S&P 500 (SPY)

Stocks jumped by around 50 basis points with the S&P 500 closing at 3,386. We hit a little bit of resistance at 3,393 yesterday. Anyway, we couldn’t punch through, which is fine. It isn’t a race, and the market rising at a measured pace is undoubtedly better than a freight train, although there are a few of those running around.

The next level I’m looking for here on the S&P 500 comes around 3,430. The RSI still looks healthy around 65. Additionally, the advance/decline line also looks healthy. So overall, the trend remains we have been saying, higher.
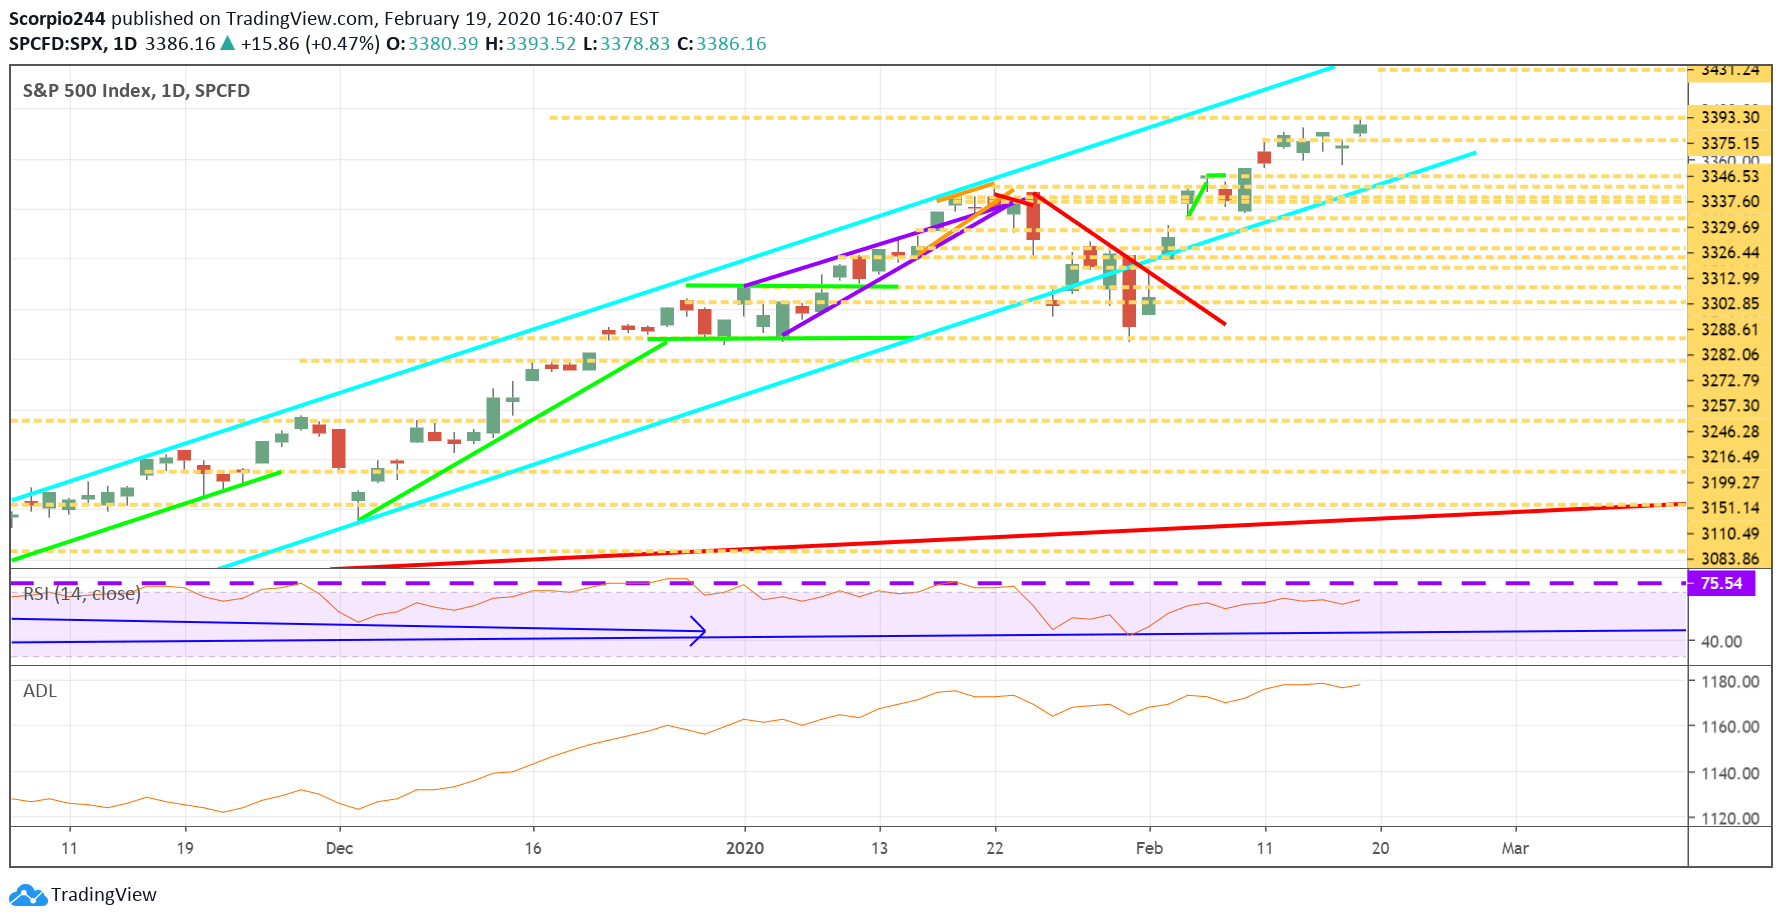
S&P 500 Index Daily Chart

Oil

Oil broke resistance at $52, and that $54.30 is the next level to look for there. Again, the RSI is trending nicely higher there.
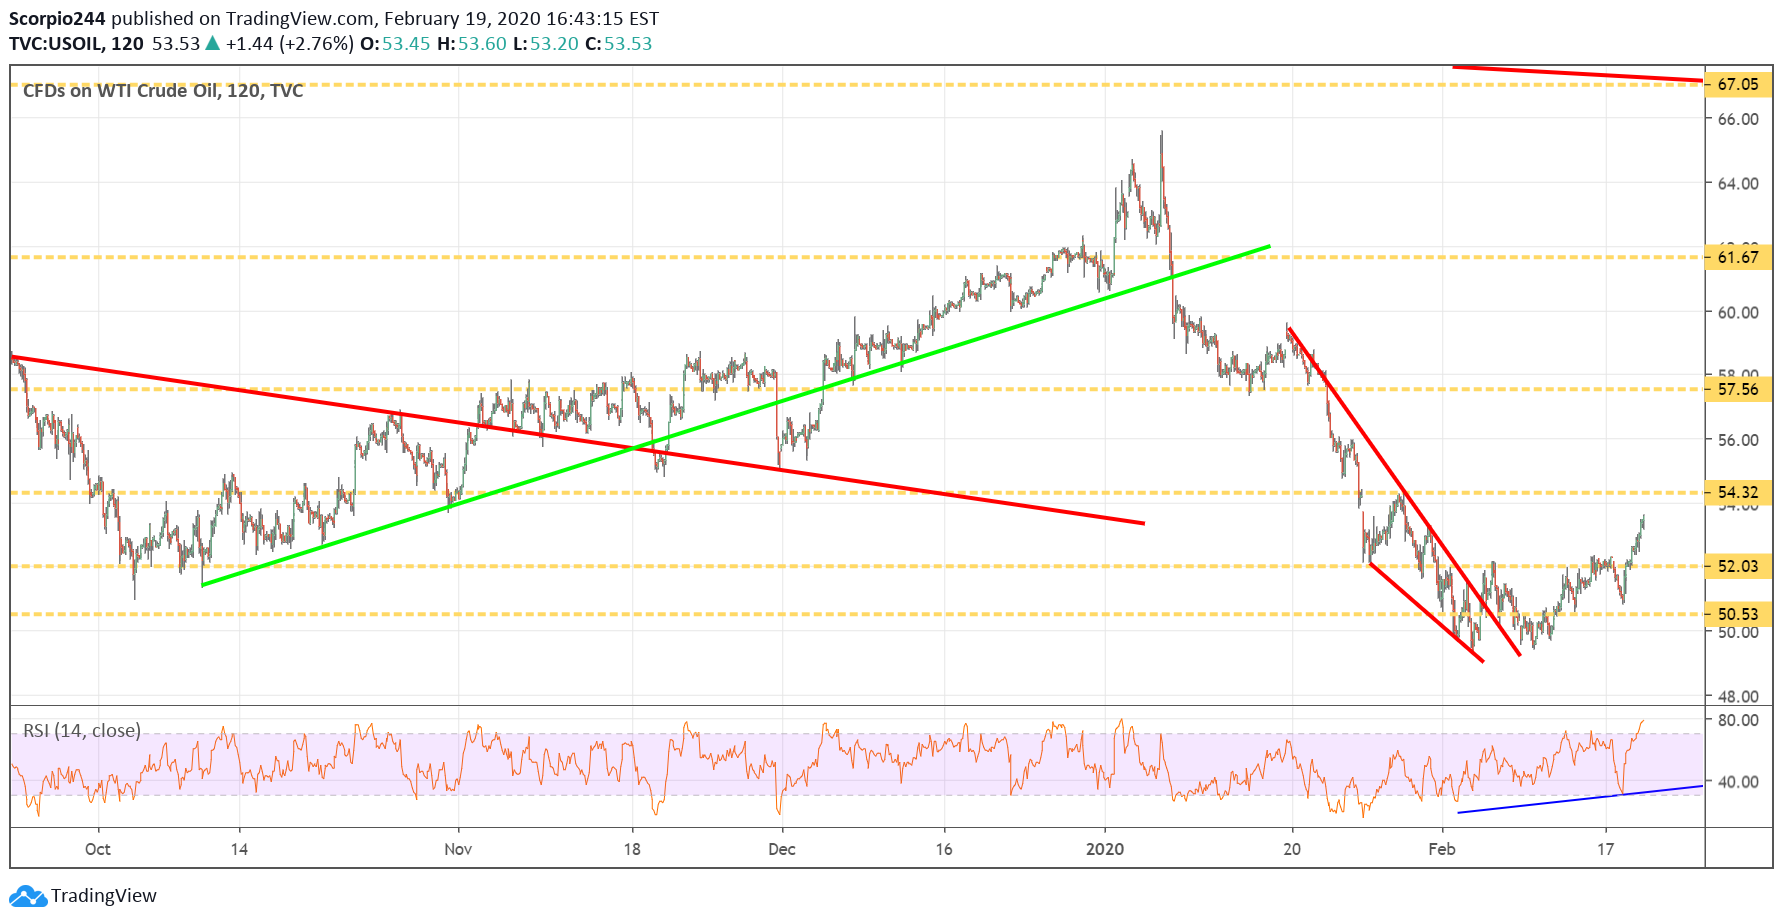
WTI Crude Oil Chart

Amazon (AMZN)

Amazon (NASDAQ:AMZN) had a nice day despite failing to get over resistance at $2,184. I don’t know why I didn’t see this earlier, but it looks like a nice cup and handle pattern may have formed there, that’s bullish. So perhaps it was just a one day stall.
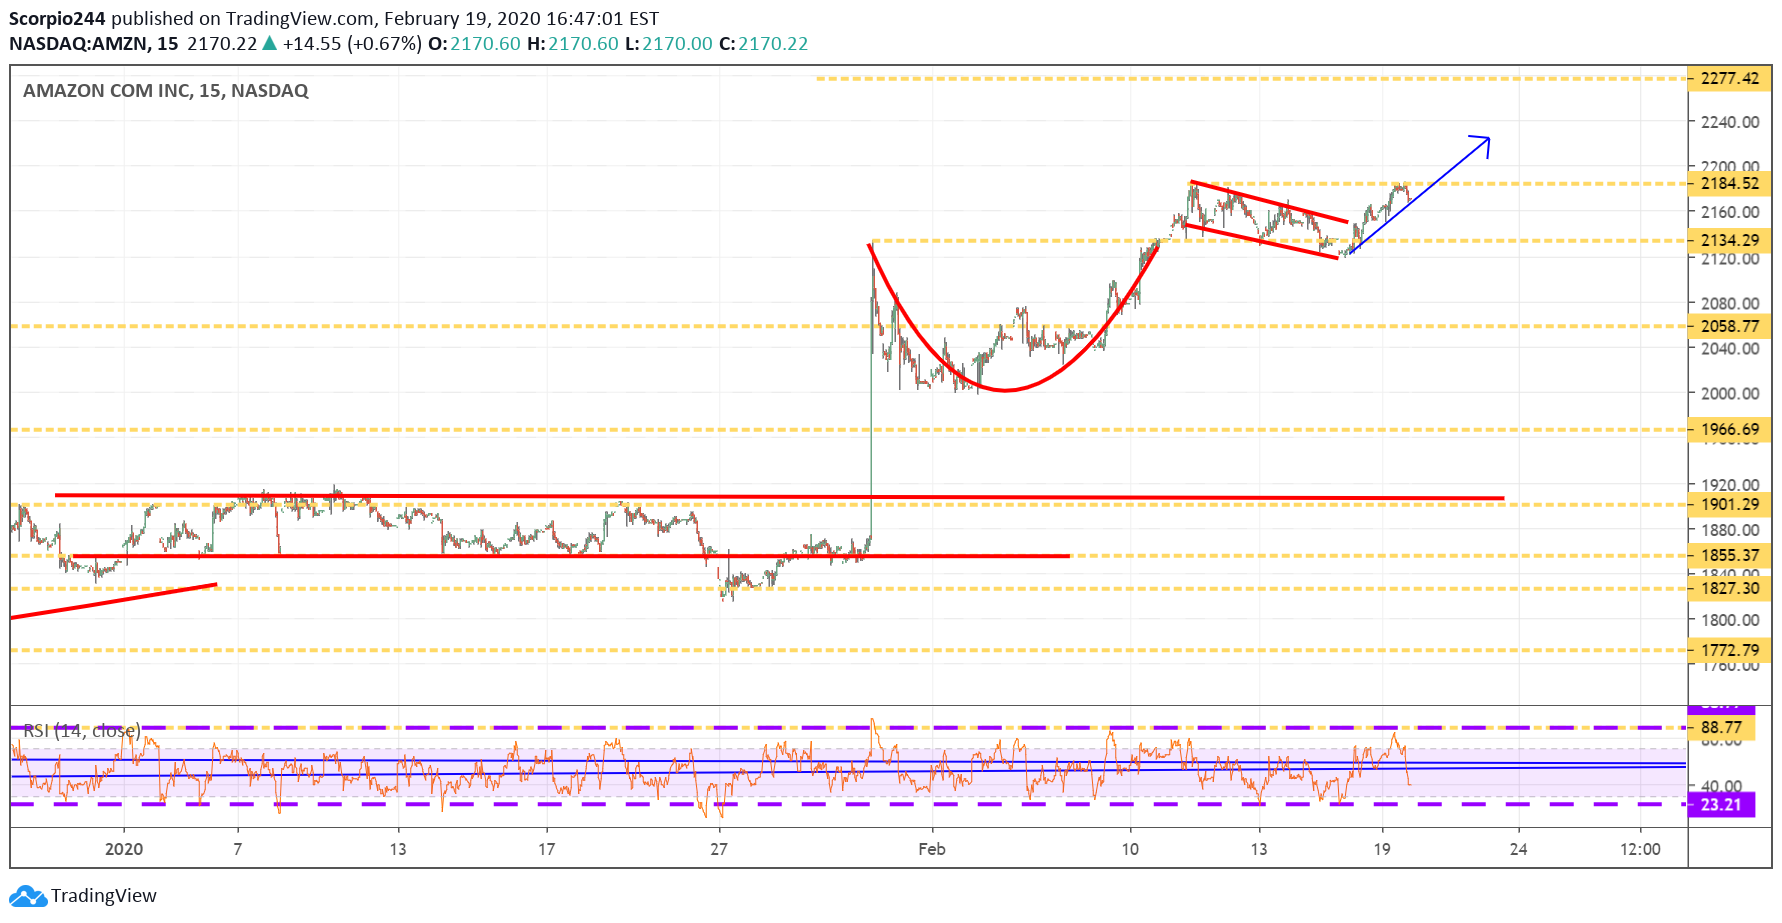
Amazon Inc Chart

AMD (AMD)

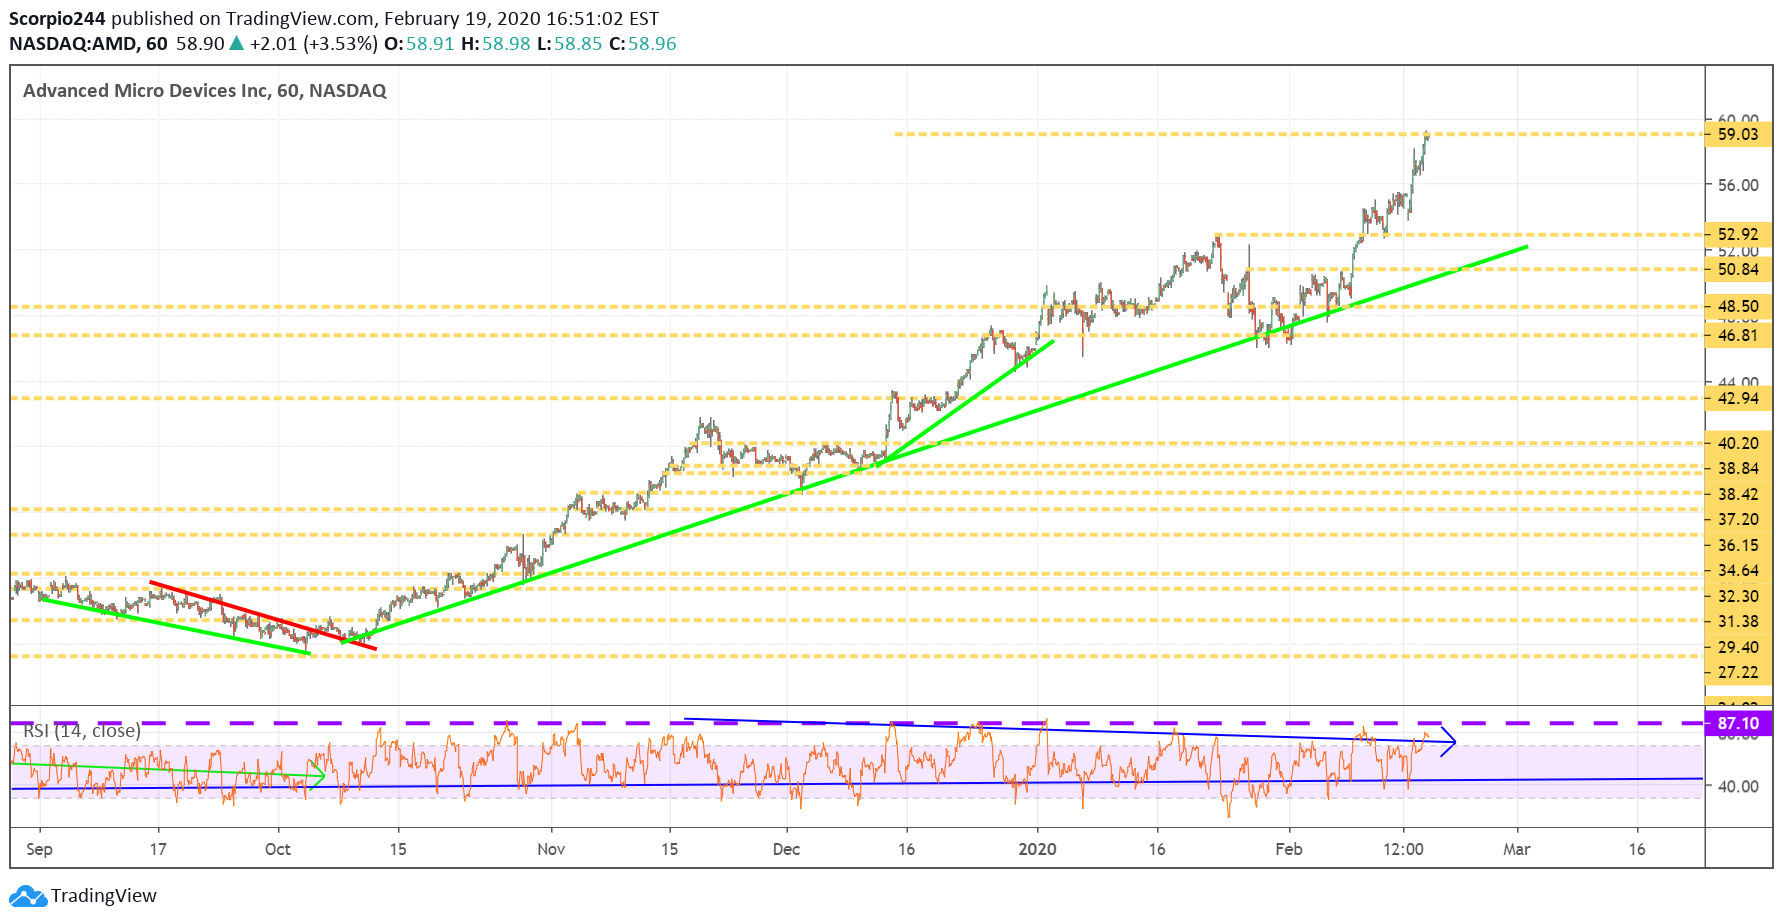
Advanced Micro Devices (NASDAQ:AMD) hit $59, crazy. To think we first talked about this level weeks ago. Anyway, I don’t know how much higher it can go. I wrote about AMD yesterday. It is now the most expensive stock in the top 25 holds of the SMH. I have seen bearish betting in recent days, and the stock is at resistance. Lets stick with the view shares go back to $53.
3rd party Ad. Not an offer or recommendation by Investing.com. See disclosure here or remove ads .
AMD Inc Chart

JD.com (JD)

JD.com (NASDAQ:JD) has a great looking chart, and it looks like it getting ready for a move up to $45.30. The RSI is pointing in the right direction too.
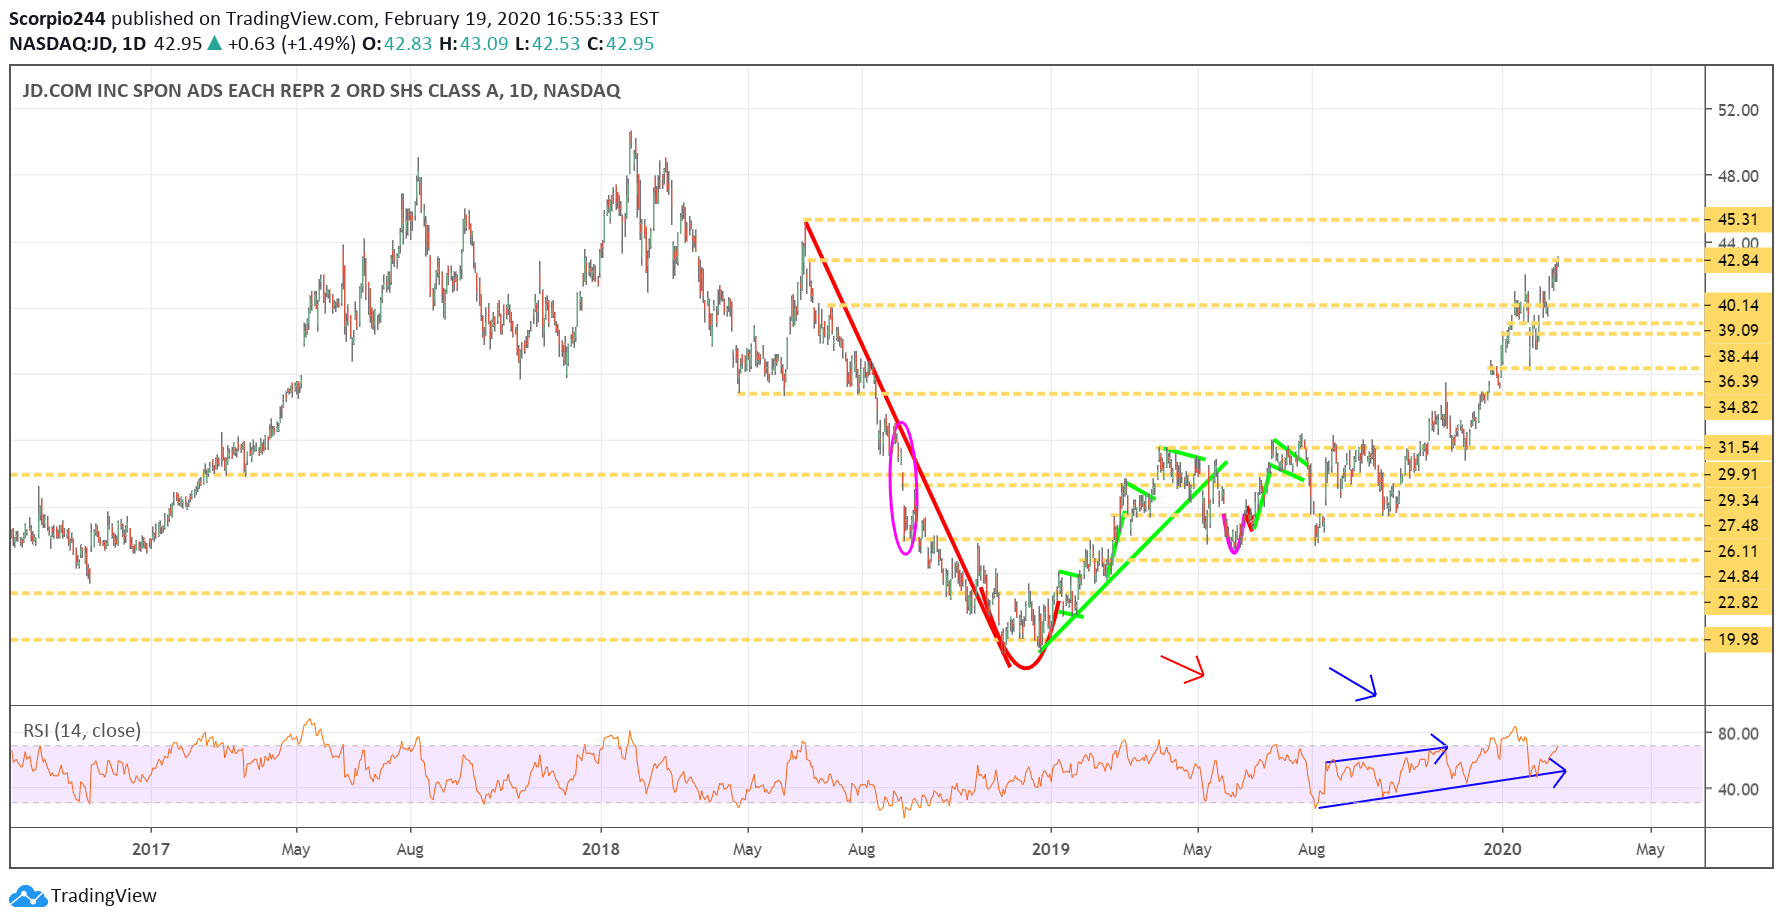
JD.com Daily Chart

Exxon Mobil (XOM)

Oil prices are rising; maybe even Exxon (NYSE:XOM) can bounce, hey anything is possible. If it should jump $63.40 is the next level to watch. The good news is that support at been relatively firm.
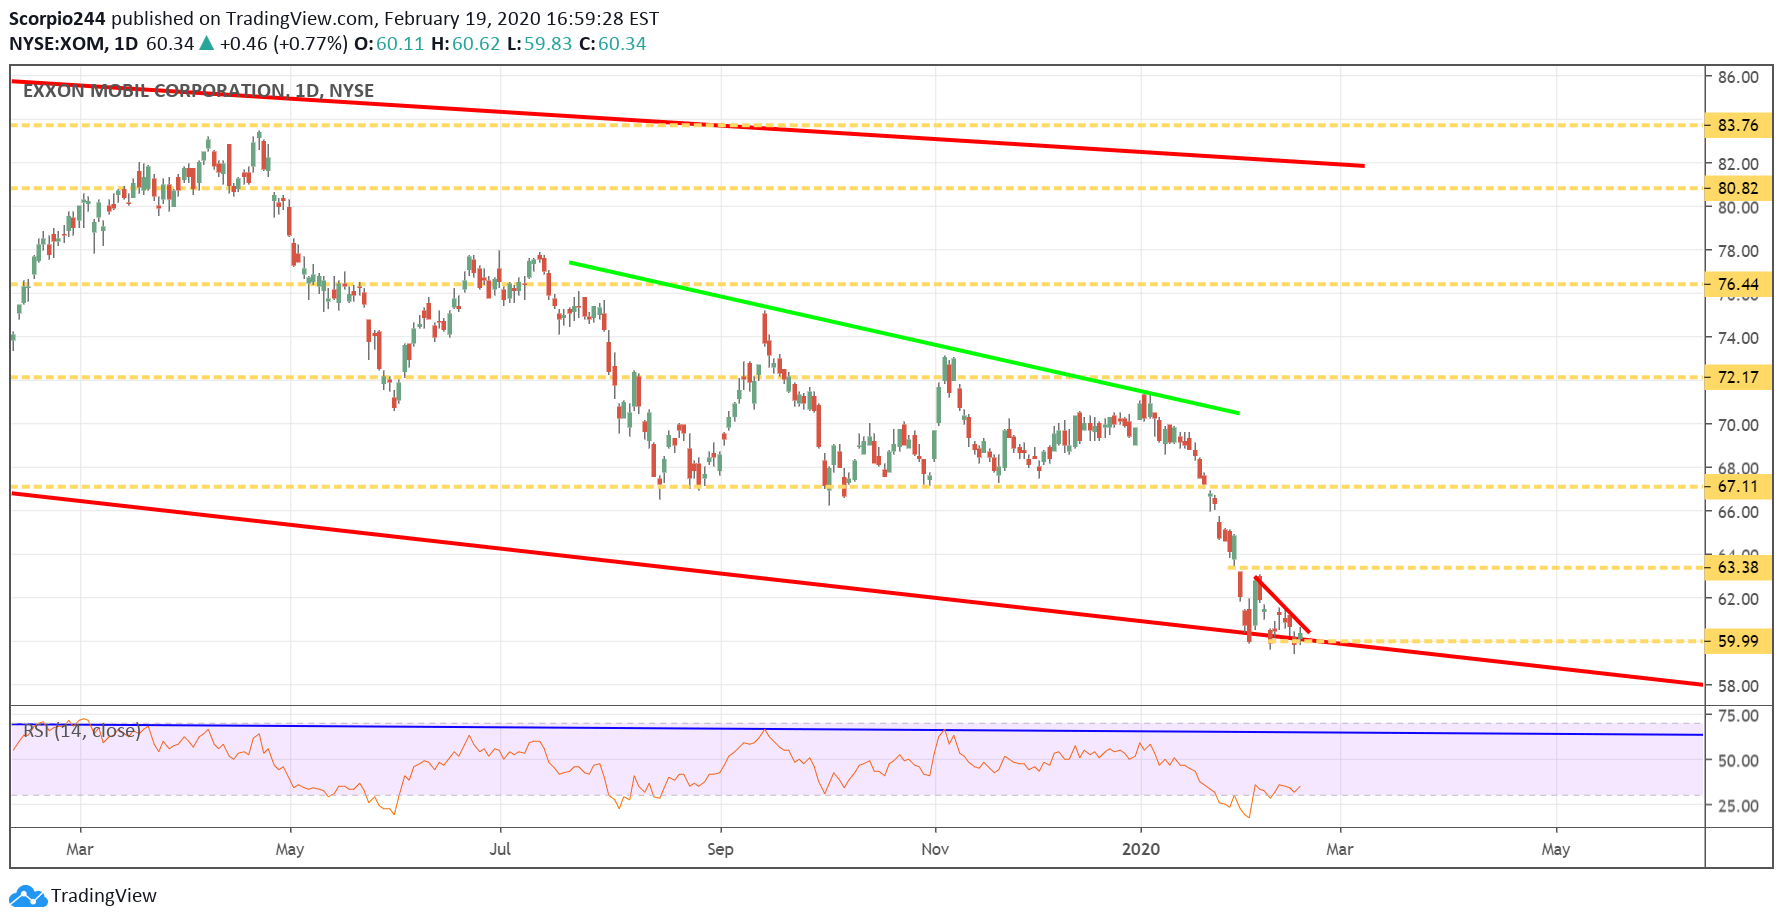
Exxon Mobil Daily Chart

Virgin Galatic (SPCE)

Virgin Galatic, I don’t know what’s going on here, it’s insane. According to what I read in the SEC filing, there are only 31 million shares available to trade? And it traded 100 million shares yesterday another 80 million yesterday! I don’t know that is insane.
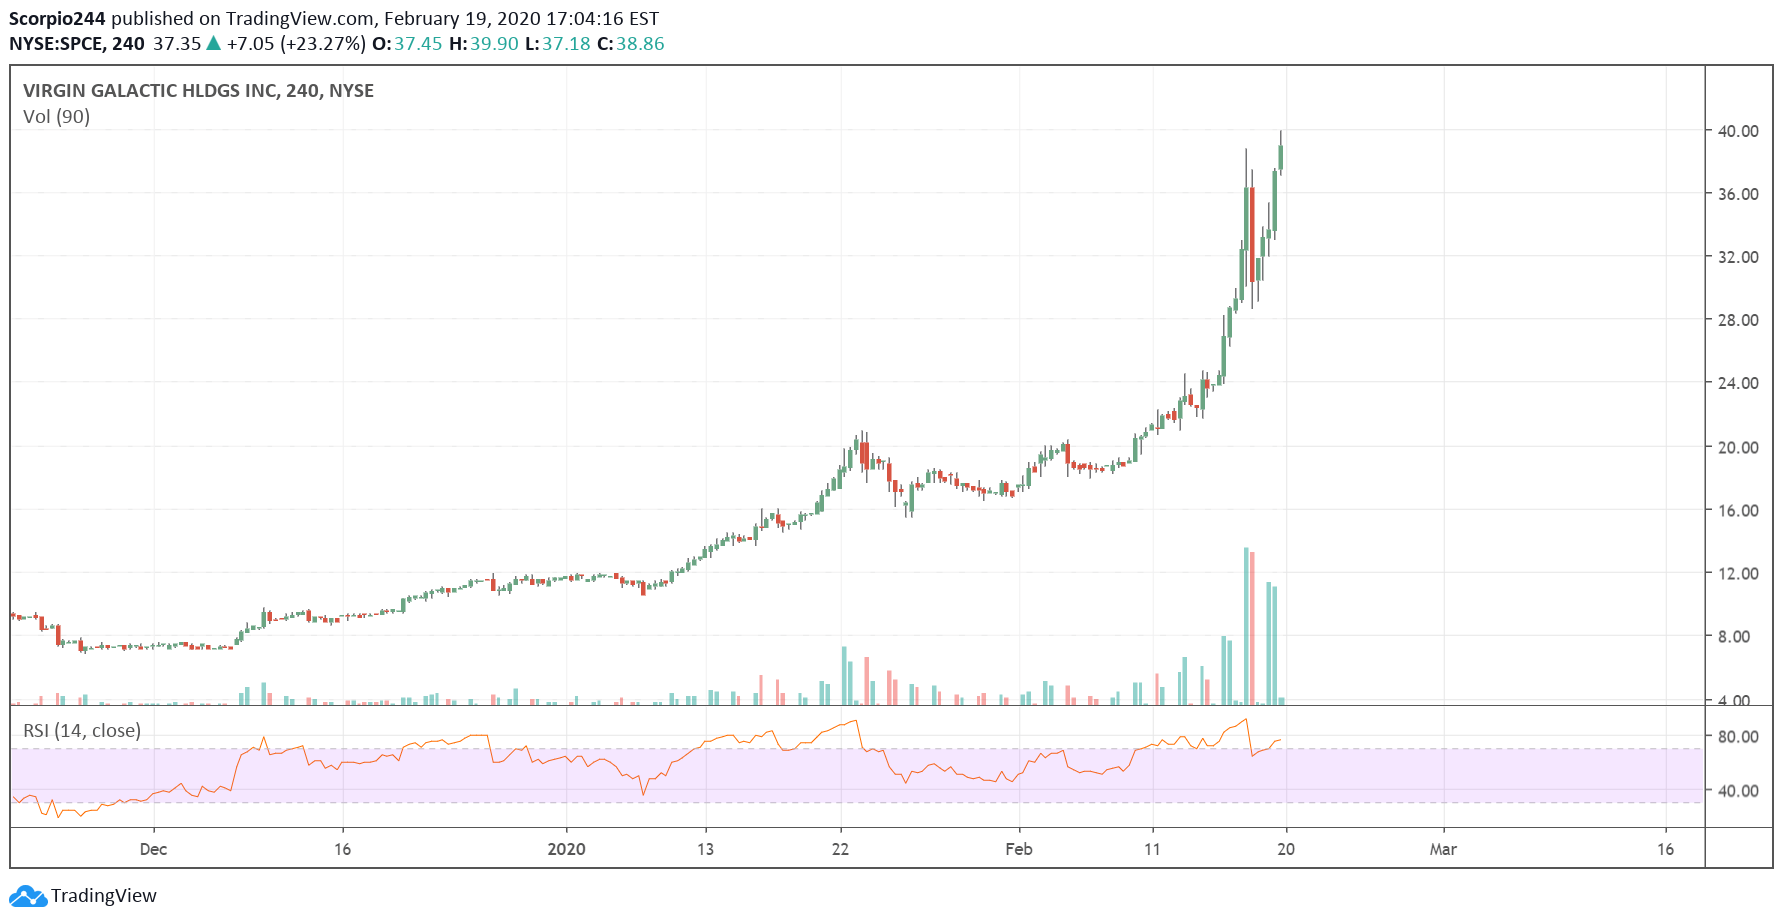
Virgin Galatic 240 Min Chart

Original Post

Latest comments

whats your opinion on roku for the next two days? theres is room to expand i think..
Risk Disclosure: Trading in financial instruments and/or cryptocurrencies involves high risks including the risk of losing some, or all, of your investment amount, and may not be suitable for all investors. Prices of cryptocurrencies are extremely volatile and may be affected by external factors such as financial, regulatory or political events. Trading on margin increases the financial risks.
Before deciding to trade in financial instrument or cryptocurrencies you should be fully informed of the risks and costs associated with trading the financial markets, carefully consider your investment objectives, level of experience, and risk appetite, and seek professional advice where needed.
Fusion Media would like to remind you that the data contained in this website is not necessarily real-time nor accurate. The data and prices on the website are not necessarily provided by any market or exchange, but may be provided by market makers, and so prices may not be accurate and may differ from the actual price at any given market, meaning prices are indicative and not appropriate for trading purposes. Fusion Media and any provider of the data contained in this website will not accept liability for any loss or damage as a result of your trading, or your reliance on the information contained within this website.
It is prohibited to use, store, reproduce, display, modify, transmit or distribute the data contained in this website without the explicit prior written permission of Fusion Media and/or the data provider. All intellectual property rights are reserved by the providers and/or the exchange providing the data contained in this website.
Fusion Media may be compensated by the advertisers that appear on the website, based on your interaction with the advertisements or advertisers.
© 2007-2024 - Fusion Media Limited. All Rights Reserved.