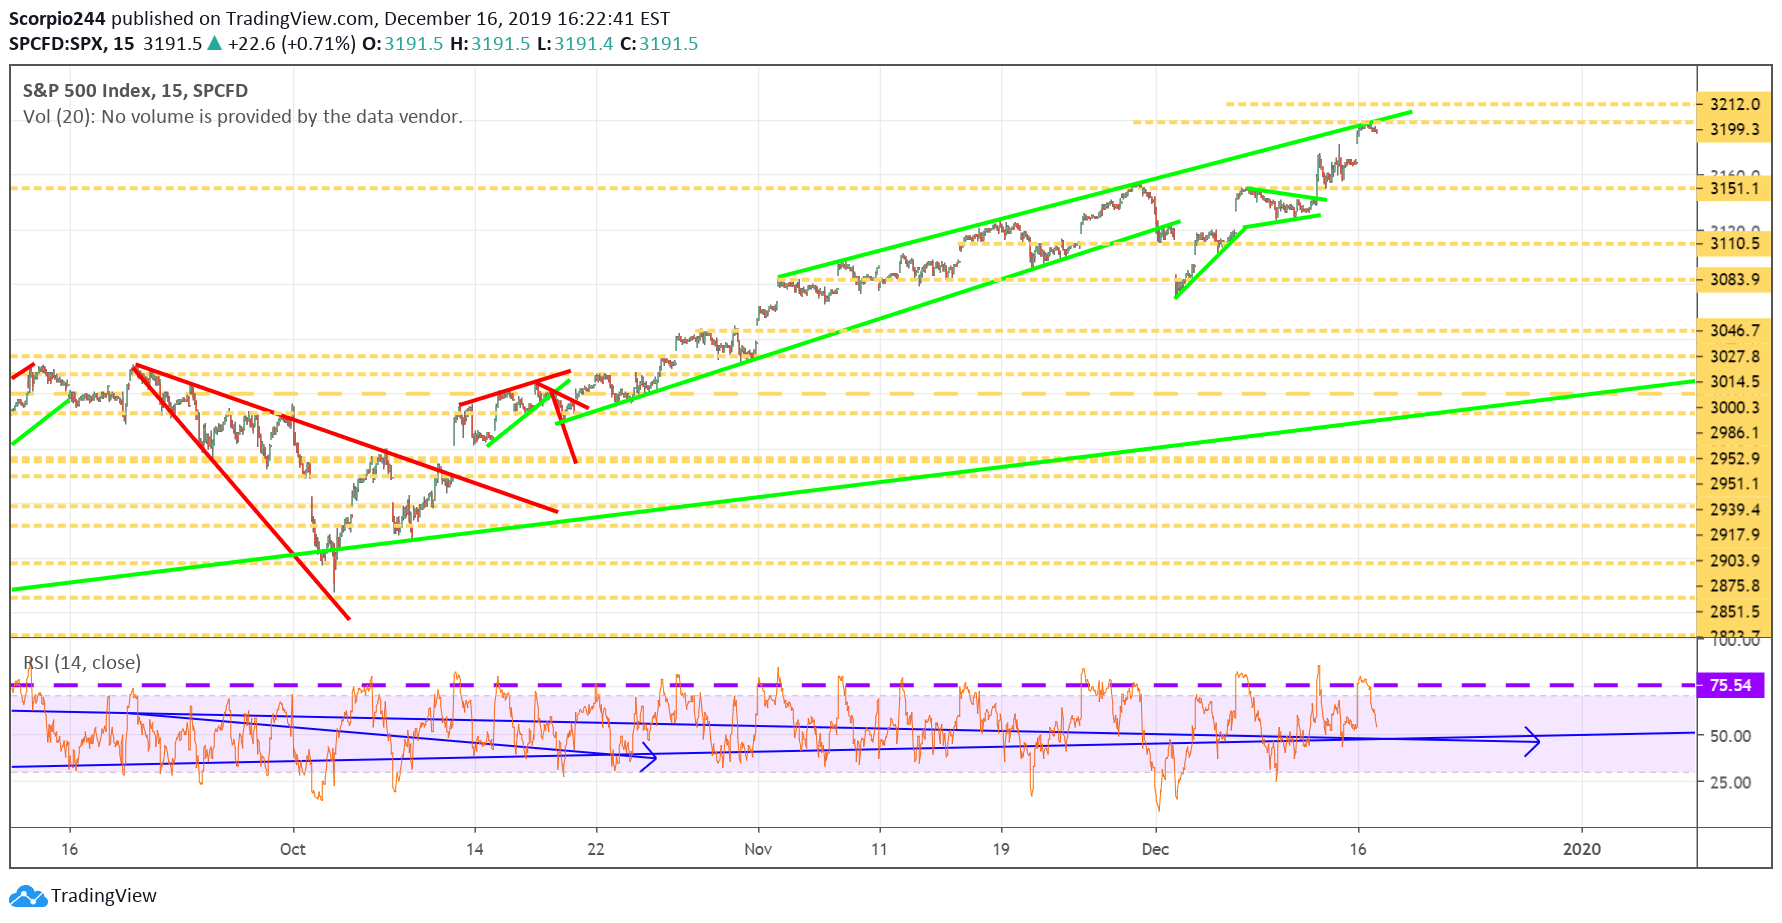
It was another up day for stocks with the S&P 500 rising by 72 bps to 3,191. The index got as high as 3,198 and turned lower. The index is now bumping up against resistance at the uptrend that has been in place since November 1. A gap-fill to 3,170 today would undoubtedly be helpful. It would help to prolong the rally and give the market a chance to rest. I’m not too fond of when the markets move this rapidly.
However, I’m not sure what today will bring. It feels as if there are too many investors trying to play catch-up and trying to put money to work as to not feel stupid at year-end.
But in all honesty, you can’t make up 20% of missed performance in 4 weeks, let alone 2 weeks. Yeah, the Eurekahedge Hedge Fund Index was up just 7% at the end of November. That was when the S&P 500 Total Return was up almost 28%.
Too late? I’d say so.
Tesla (TSLA)
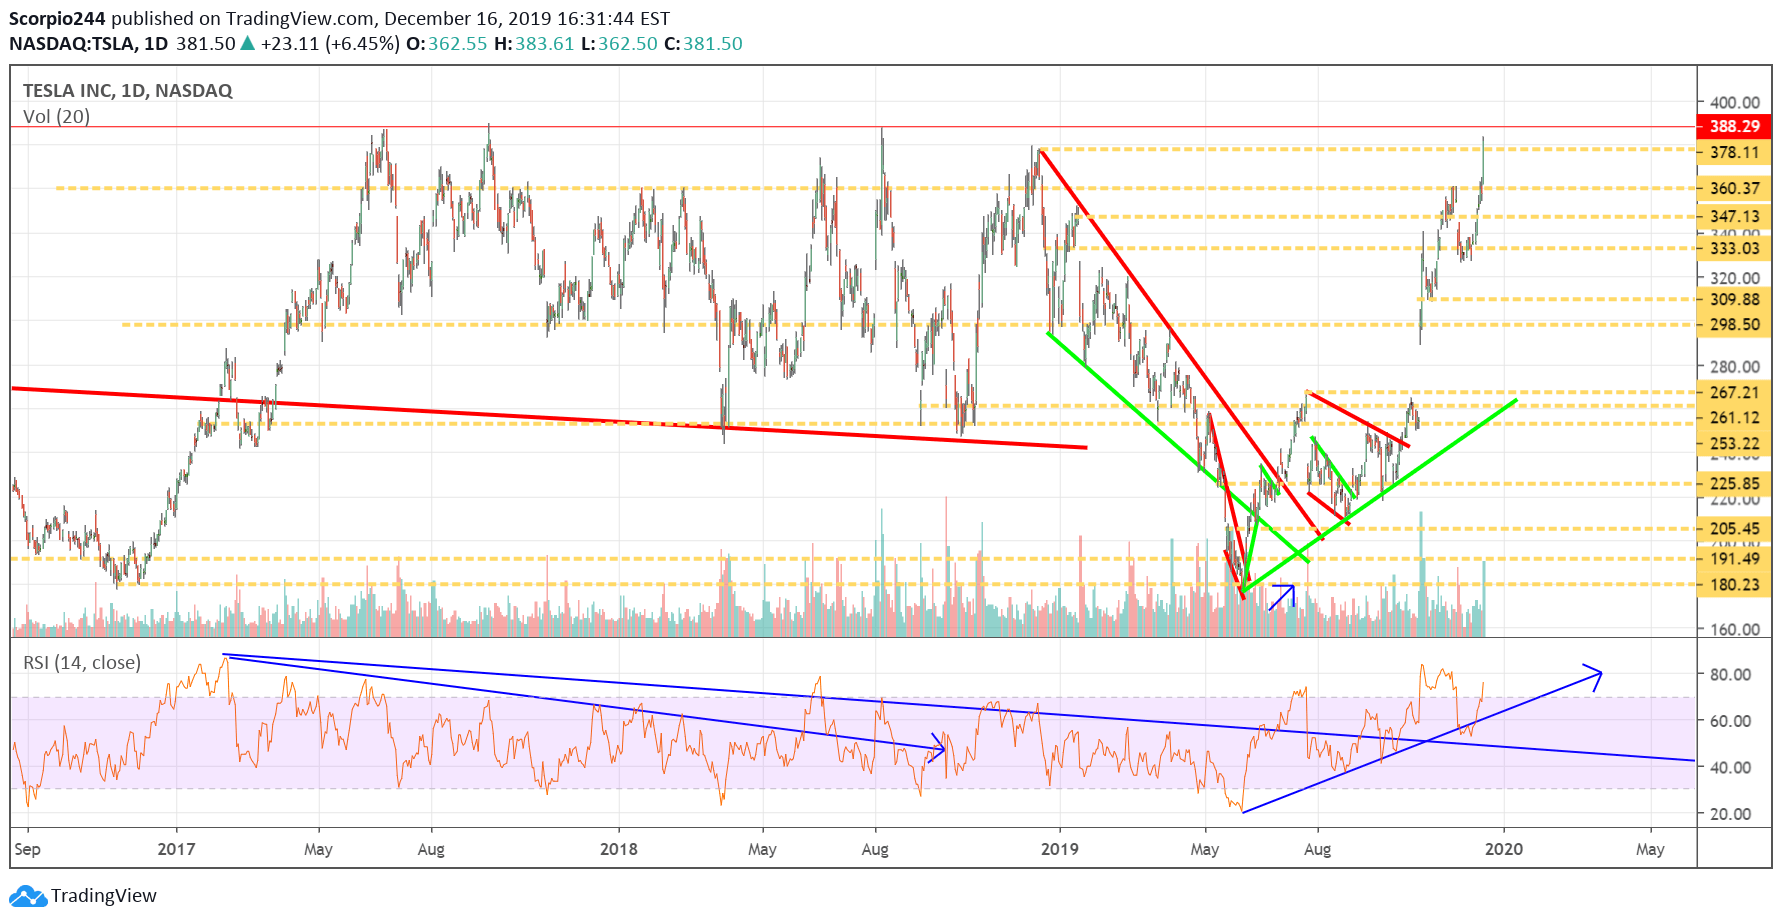
Tesla (NASDAQ:TSLA) had an incredible day rising on hopes the EV tax credits would be extended. The stock rocketed higher to close above $380 for the first time since December 2018. The big question, what now? So here’s the thing, the stock has failed at $388 three prior times, and I would think the stock doesn’t fail for the fourth time. Also, unlike the previous times, the relative strength index has been trending higher, not lower. You can see in the chart how the RSI peaked in February 2017, but the stock continued to rise, creating a bearish divergence. This time the RSI is still climbing, and I think that means this stock moves to $400. Should that happen, support at $390 should be strong in the future.
Uber (UBER)
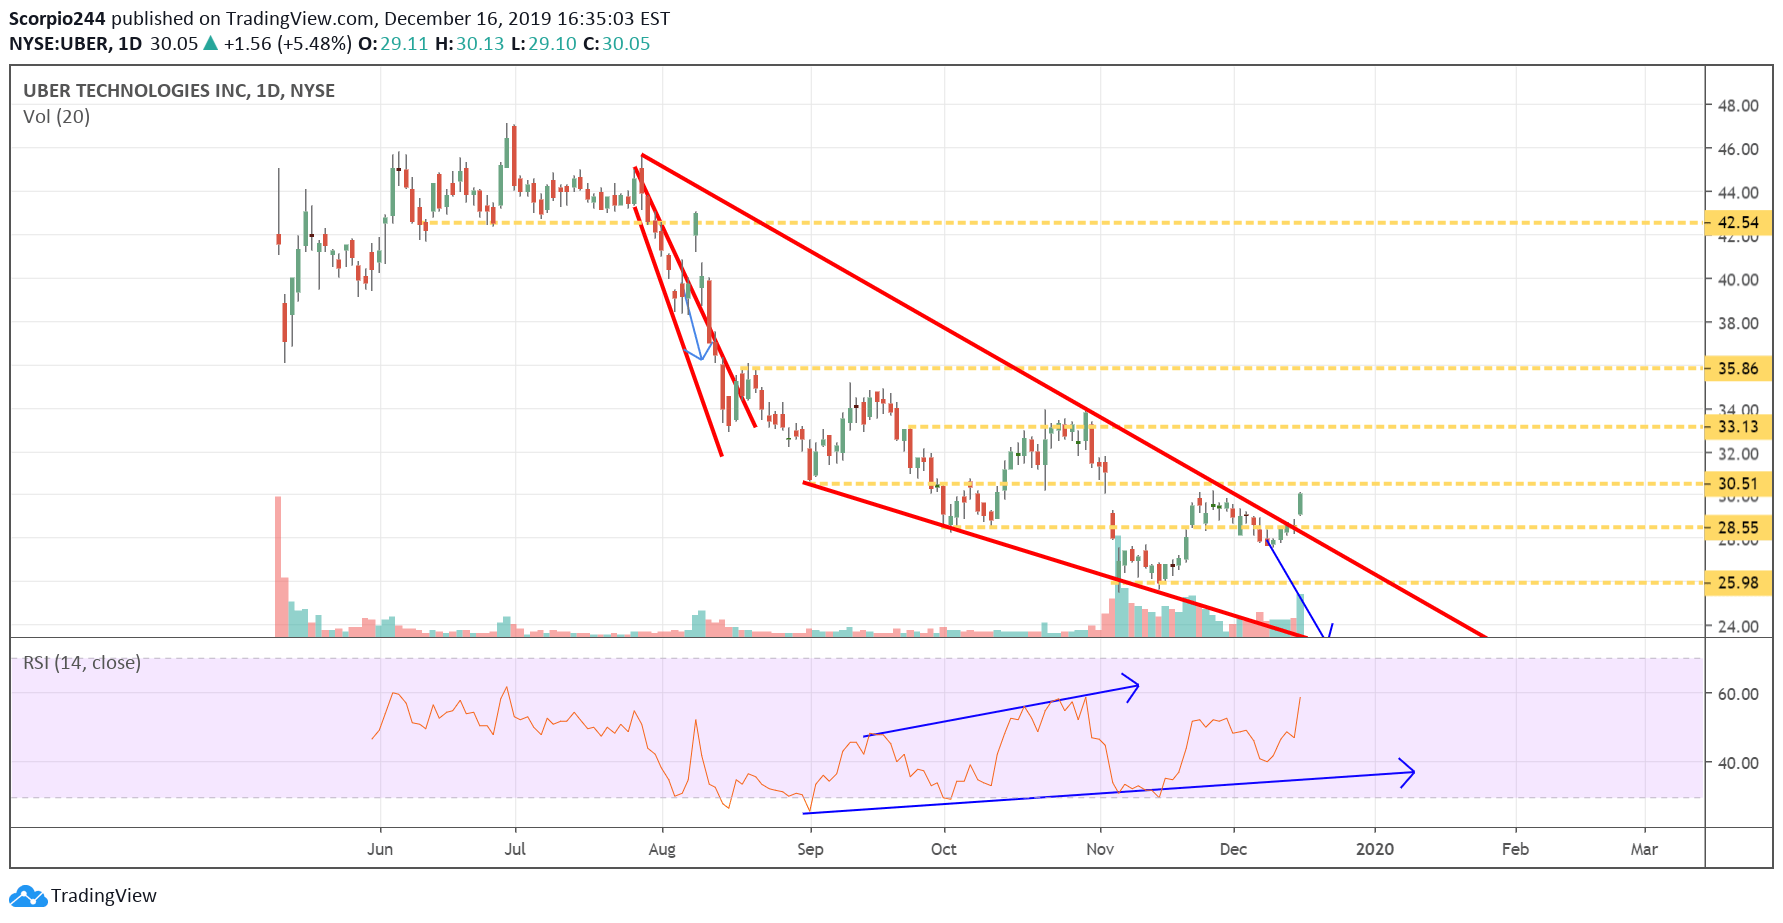
Uber (NYSE:UBER) broke out of its falling wedge pattern, and that means my thoughts the stock would fall are wrong. The stock’s RSI is clearly showing bullish momentum, with the potential for the stock to rise to resistance at $30.50 and perhaps on to $33.20.
Acadia (ACAD)
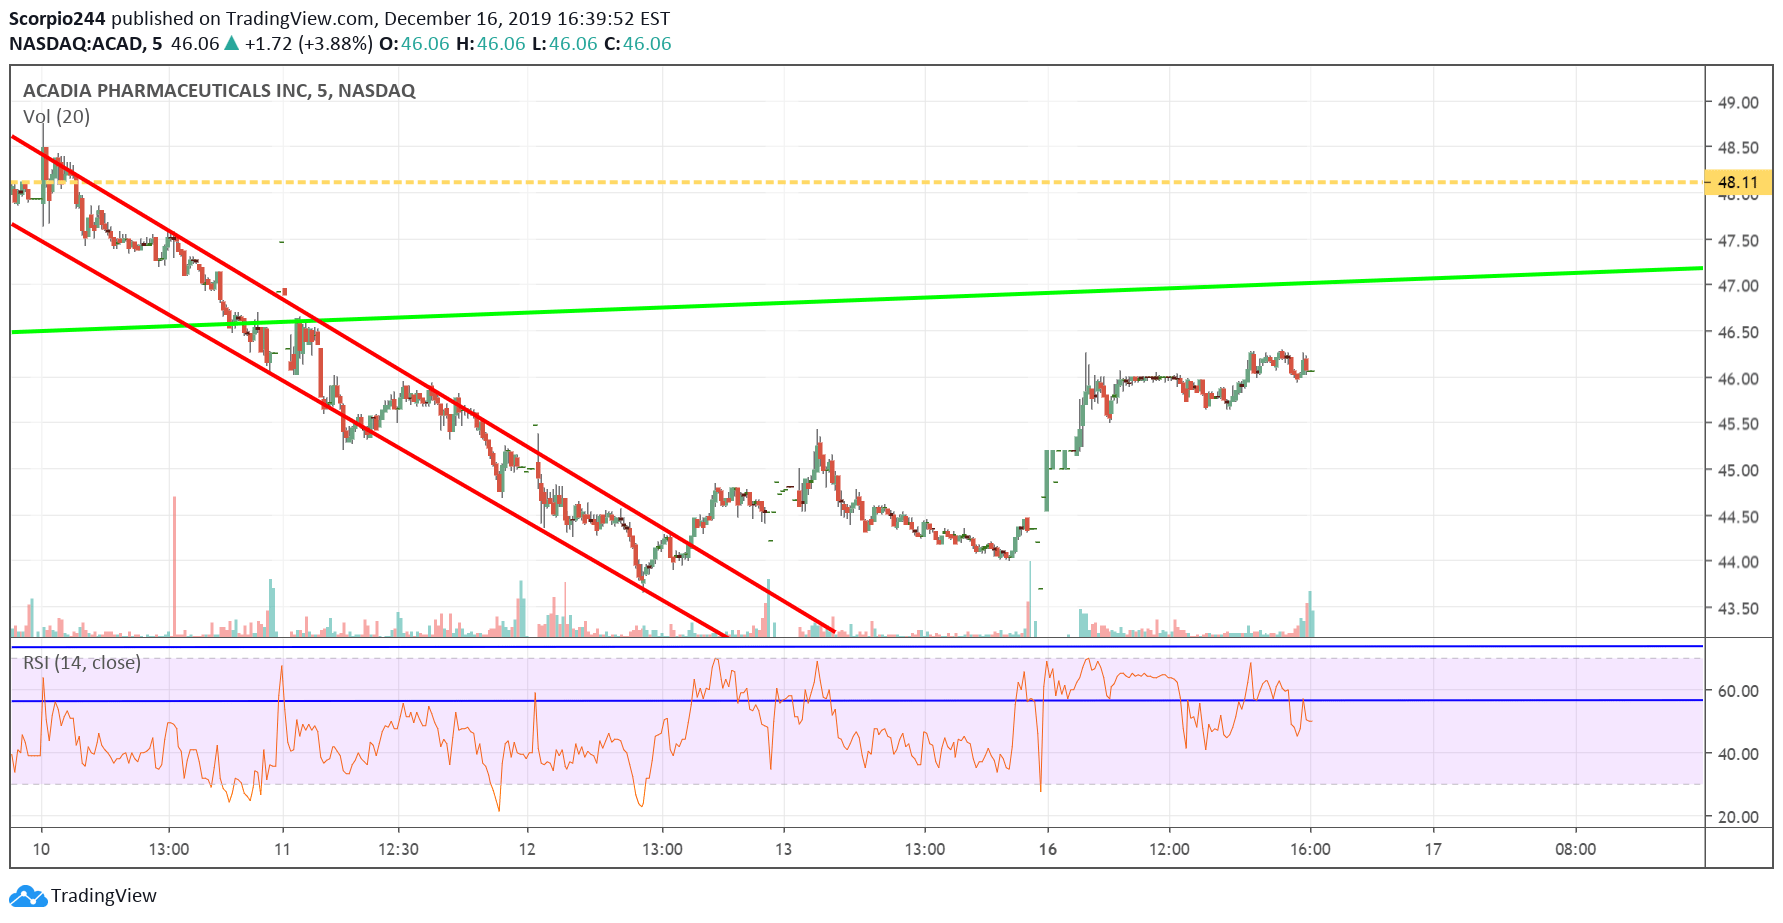
ACADIA (NASDAQ:ACAD) got above $46. It seems there was a seller for part of the day at $46 based on that flat-lining around lunchtime. I still think it goes back to $48.
Oracle (ORCL)
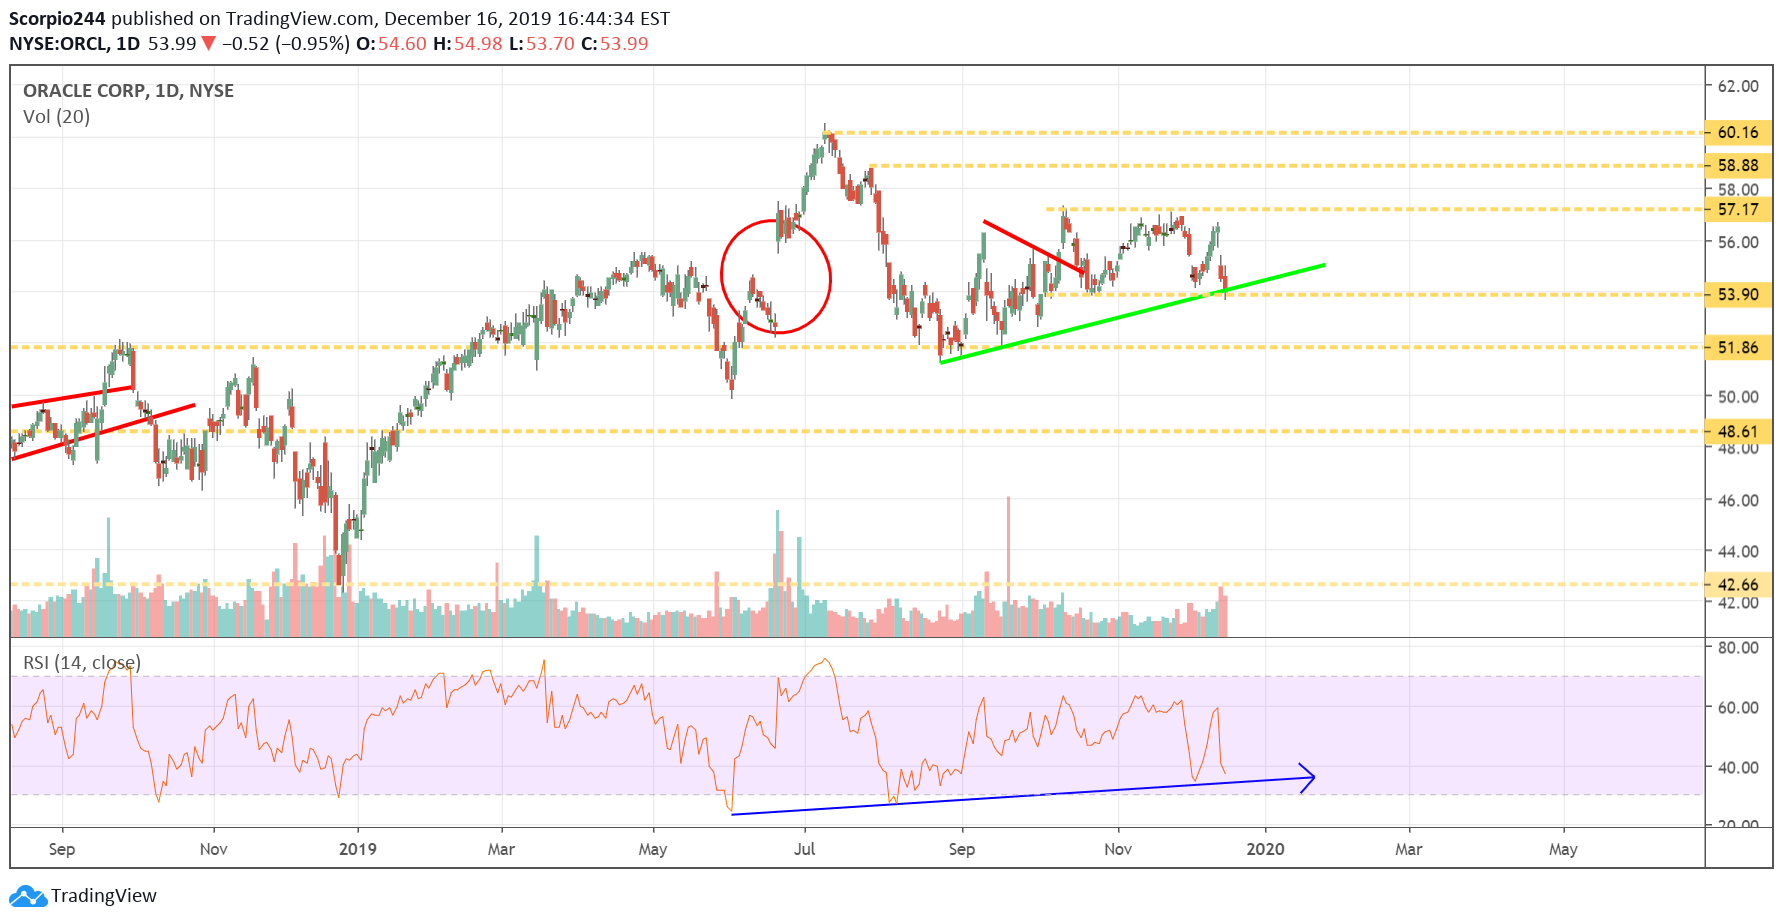
I saw a bunch of bullish betting in Oracle (NYSE:ORCL) yesterday that suggests the stock goes up. The good news is that the stock is trending higher.
Boeing (BA)
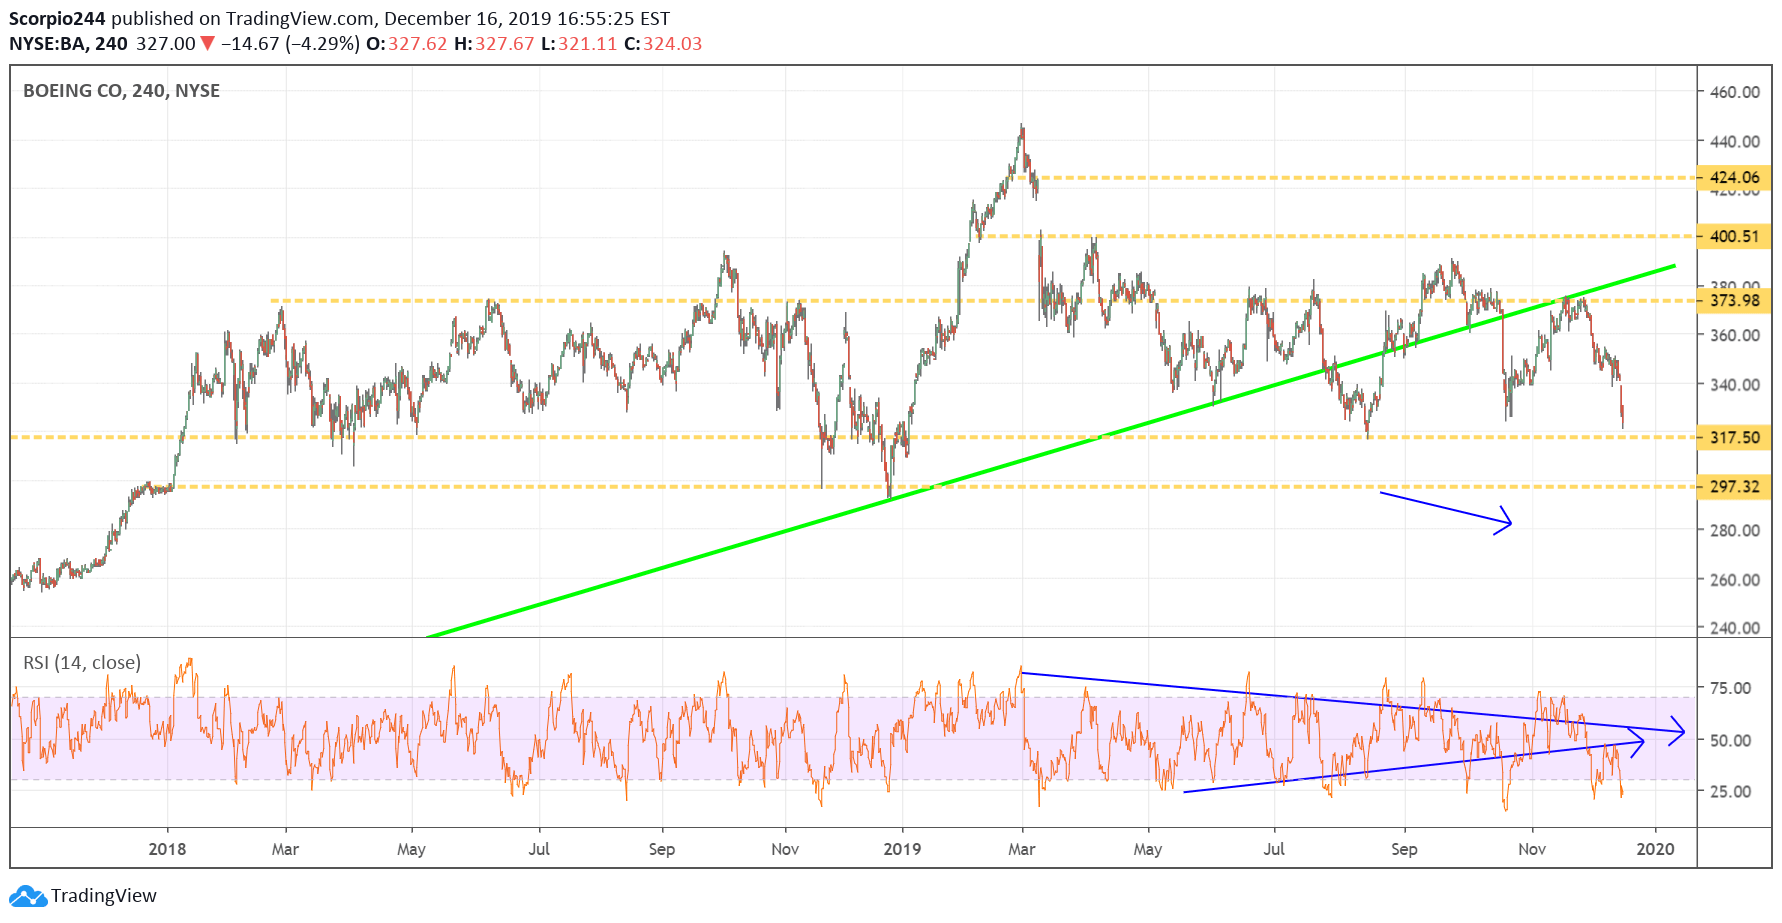
Boeing (NYSE:BA) is falling after hours on reports it is halting 737- MAX production in January. For now, this $320 region is the significant level that needs to be watched. The stock can’t afford to test support at $297.
