
The Future is Not Predictable
The job of a stock market trader may seem simple; learn how to predict when stock prices will go up or down, and then buy at low prices and sell at high prices. Alternatively, since stock prices have tended to rise in the long run, despite temporary declines, buying stocks and holding them for several years – investing – may seem like an almost-guaranteed method of ensuring that the selling will occur at a higher price, without the need to make the predictions involved in short-term trading.
In reality, neither trading nor investing is as simple as it might appear. Each is fraught with obstacles that have the potential to lead one into financial ruin. That’s because each method, though quite dissimilar, is based on the same paradox.
Short-term trading involves predictions about how stock prices will move in the near future. Long-term investing, though generally not concerned with the near future, nonetheless involves making a prediction – a prediction about the distant future. There’s just one problem: the future hasn’t happened yet, so it can’t be predicted.
Therein lies the paradox. Participating in the stock market involves making predictions, yet predicting the future is impossible. In that regard, short-term trading is no different than long-term investing, in that each involves predicting that which is impossible to predict.
Patterns Tend to Repeat
It is true that the past may yield clues to the future. Patterns of stock prices do have a tendency to be repeated, particularly patterns that have proven beneficial to those participants who have the ability to induce them. Let’s face it; if a pattern didn’t benefit someone, it’s unlikely it would be repeated. The fact that a recognizable pattern exists lends credence to the likelihood that such a pattern is being exploited by some, for their benefit.
A pattern with a name suggests that such a pattern has been repeated with enough regularity for someone to recognize it, label it, and for others to then adopt the use of the name when they themselves recognize it. Pattern recognition is thus one of the only means by which the ordinary stock market participant can expect to profit, since it is among the few means by which one can identify probable movements of stock prices in the future.
Ordinary stock market participants do not normally have the ability to influence patterns. Even as a herd, the collective participation of individual participants and individual institutions around the world is more likely to be intentionally steered into a trading pattern than to actually have a say in how the pattern plays out. There is always someone, or something, doing the steering. So, the herd is essentially powerless to do anything but react; and reactions of the herd are quite predictable.
What is not predictable, at least not by conventional means, are the actions of those responsible for doing the steering. It is not possible to predict what the stock market will do in the future because it is not possible to know the plans of those doing the steering.
What is predictable is that those doing the steering will do things in the future that have benefited them in the past. That means there will be patterns, and that those patterns will have a tendency to be repeated. It also means that future patterns will always vary somewhat from past patterns, because those doing the steering would lose all benefit of the pattern if the herd was allowed to adapt to, even anticipate, the next move.
The best a trader can hope for, in the absence of being among those doing the steering, is to recognize the clues being given by those who have the greatest influence over the current pattern. No trader is likely to be able to predict the future consistently. But almost any trader can learn to recognize patterns.
Key to Stock Market Success
They key to success in the stock market is therefore quite simple. One must learn to recognize a pattern and then ride the coattails of the folks using that particular pattern for their benefit. One must also learn to jump off of those coattails when the benefit no longer exists. One must be ready to part from the herd the moment it becomes apparent the herd is being steered in a way that is not in its best interest.
For a long-term investor, the pattern is simple: stock prices in general have always risen, eventually, no matter how far they may temporarily decline. Perhaps that pattern will continue to be repeated, perhaps not. The answer depends on the intentions of those steering the market; and without knowing those intentions it is not possible to predict whether the pattern will be repeated or not.
There are certainly steps a long-term investor can take to make sure a failure of the pattern to be repeated will not result in financial ruin. Risk management, asset allocation and position sizing can all be used to avoid financial ruin. The options market is available for everyone, including long-term investors, as a means of avoiding catastrophe if the herd gets led astray.
For some ideas for protecting long-term stock market investments, the following recent article may be helpful: Insure Stock Portfolio for $1 Per Day.
For a short-term trader, pattern recognition is not nearly as simple. There are countless patterns, some of them recognizable, some of them not; and even the most recognizable ones may be dependent upon the time frame of the viewer. A highly visible pattern on a 1-minute chart may not be at all visible on a daily chart, for example.
Time-Dependent Patterns
The options market is particularly well suited to helping traders recognize patterns that transcend time frames. That is because every option contract makes an allowance for the passage of time. Thus, while an analysis of stock prices may reveal entirely different patterns depending on whether one chooses short time frame of just a few minutes or a long time frame of several days or weeks, an analysis of options will very much, much less.
One area in which the options market typically pretty accurate is the near-term prospects for a Bull or Bear market for the S&P 500 index as a whole. The options market does not predict what will happen in the future, but it has been historically accurate at signaling shifts in the herd between bullishness and bearishness.
Basically, the following analysis of the options market shows how the herd is likely to react in the future if it is allowed to move on its own, without being steered by any outside forces. Like almost any form of analysis, it cannot predict whether the herd will be steered in a different direction. It can only predict how the herd will react, based on how it has reacted in the past.
The value of predicting the herd’s reaction might not immediately be apparent, given the inability to predict how it might be steered of its natural course. However, if one knows how the herd is likely to react, a failure to react as predicted implies that something has steered it away from its natural course.
Thus, the value of the following analysis, aside from a broad overview of the current condition of the S&P 500, may be found in the ability to infer steering forces from any failure of the herd to react as anticipated. Whenever the S&P 500 moves in a way that defies typical herd mentality, it implies that outside forces are at work, and those forces are steering the S&P 500 in the direction those forces want it to go. Riding the coattails is sometimes as simple as trading in the same direction as the implied force.
The Herd is Easily Predictable
Presumably, the herd will never change. The herd today is the same as the herd of 100 years ago and the same as the herd will be 100 years from today. The tools may change, but the herd will not. Outside influences may change, but the herd will not.
Wars, natural disasters, governments and banking institutions will all steer the stock market from time to time; they always have. But, those influences will not change the basics of the herd itself. Thus, it will likely always be possible to predict how the herd should react, then observe how the herd does react in order to infer how the herd is being steered.
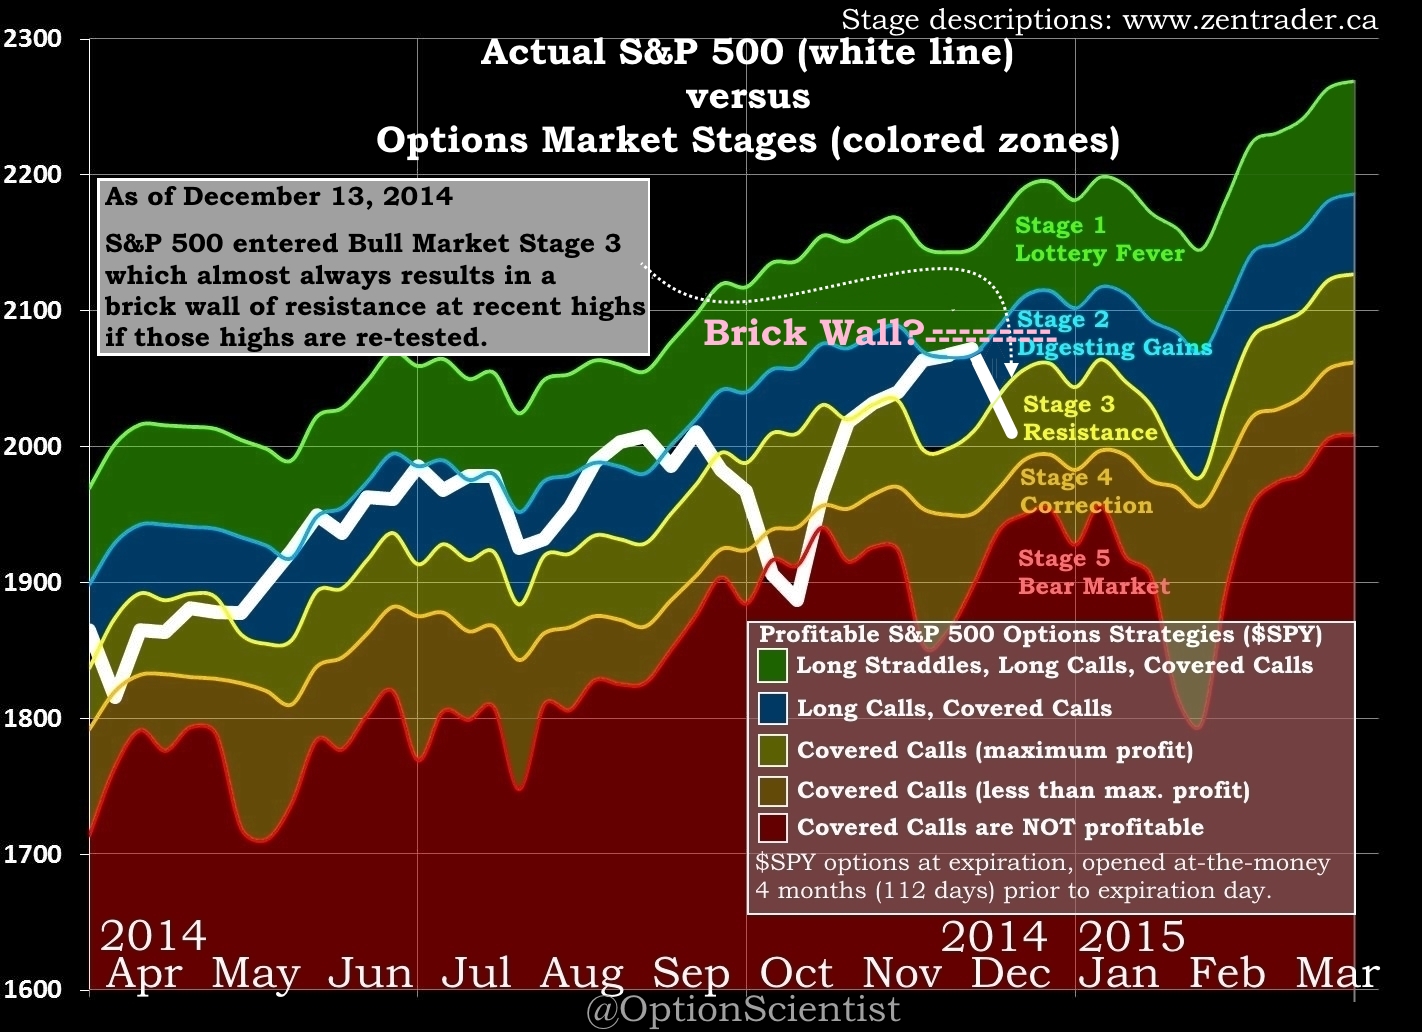
This is how the herd is likely to react. The S&P has reached Bull Market Stage 3. The usual reaction of the herd after reaching Stage 3 is for it to shift to a “sell the rip” mentality. Traders look to exit on highs because Stage 3 can only occur when an uptrend has suffered a major loss of momentum. Essentially, each rally tends to be perceived by the herd as an opportunity to get out on highs entirely, to lighten up on longs, or to raise stops.
Recognizing Steering Mechanisms
The S&P 500 almost always meets a brick wall of resistance if it rallies back to recent highs immediately after it has reached Stage 3. Thus it would be expected that a brick wall should exist near the recent all-time high near the 2075 level. After reaching Stage 3, the herd is unlikely, on its own, to break through to new highs for at least several weeks unless it is being steered. Thus, new highs above 2075 through late December or early January would be a strong indication that higher prices are beneficial to those doing the steering.
The only exception to the brick-wall phenomenon, in which the herd tends to crave new highs after reaching Stage 3, is if the S&P first experiences a more serious pullback, a Bull-market correction, and then re-tests the highs. Very often the herd can achieve new highs, without outside influence, after reaching Stage 4, whereas it can only reach new highs with outside help if Stage 3 occurs without Stage 4. The S&P blew right through the previous high near the 2010 level in early November, in a textbook example of a lack of a brick wall following Stage 4; while the S&P struggled to break through a brick wall near the 1880 level this past April and May after reaching Stage 3 without having gone deeper into the correction zone of Stage 4.
The S&P is always vulnerable to a new Bear market, and that becomes a concern when Stage 3 is underway because stock prices do not need to fall terribly far for the herd to become bearish once Stage 3 is underway. In some ways, a Bear market is the natural path for the herd, after Stage 3, unless some outside force steps in to prevent a Bear market from taking hold. A bounce in stock prices before the Bear market begins can be a sign that a continuation of the Bull market is in the best interests of those doing the steering.
A Bear market, while traditionally defined as a 20% or greater decline off the highs, can often be evident prior to reaching the 20% threshold. Covered Call options often become unprofitable when a new Bear market is in its infancy. Thus, if Covered Calls were to suddenly become unprofitable, it would be an indication that the herd is not being steered, but instead being allowed to walk itself off a cliff. If the S&P goes over a cliff, it is because it is in the best interests of those doing the steering. The recent recovery of the S&P 500 after the steep decline in October brought it to the brink of Stage 5 is highly unlikely to have occurred on its own, since the tendency of the herd is to go over the cliff once Stage 5 is reached. The herd was almost certainly steered back toward all-time highs.
* All profits are calculated at expiration, as a percentage of the underlying SPY share price. SPY is an Exchange Traded Fund (ETF), the SPDR S&P 500 ETF Trust (NYSEARCA:SPY) that closely tracks the performance of the S&P 500 stock index. All options are at-the-money (ATM) when-opened 4 months (112 days) to expiration.
EXAMPLE: If Long Call premium paid is $2 when SPY is trading at $200, the loss is 1% if the option expires worthless.
If those doing the steering are going to stop the herd, before it reaches the cliff, it will very likely do so before Covered Calls become unprofitable, or at least before Covered Calls have suffered significant losses. If the S&P falls below the 1925 – 1950 zone in the next several weeks, Covered Call trading would become unprofitable.
If the S&P falls below 1925 or so in the next few weeks, it is likely that it is in the best interests of those doing the steering, to allow the herd to enter a Bear market. At that point, riding the coattails of the downtrend, for example with short stock positions, would deserve some serious consideration.
The presence of an outside influence on the herd can therefore be inferred from either a rally above S&P 2075 in the next few weeks ( in which the S&P is being steered toward much higher levels even if the herd is leery) or else a sell-off below the 1925-1950 range (in which the S&P is not being steered away from a cliff, and is instead being allowed to follow its natural tendency, which is to enter a Bear market).
Whether one gets to ride the coattails of a rally above 2075 or a sell-off below 1925, for example, depends on what the S&P 500 does in the next few weeks. It isn’t really a trader’s job to predict which coattail to ride. It is, however, a trader’s job to be prepared to ride one or the other the moment it becomes apparent that such a coattail exists.
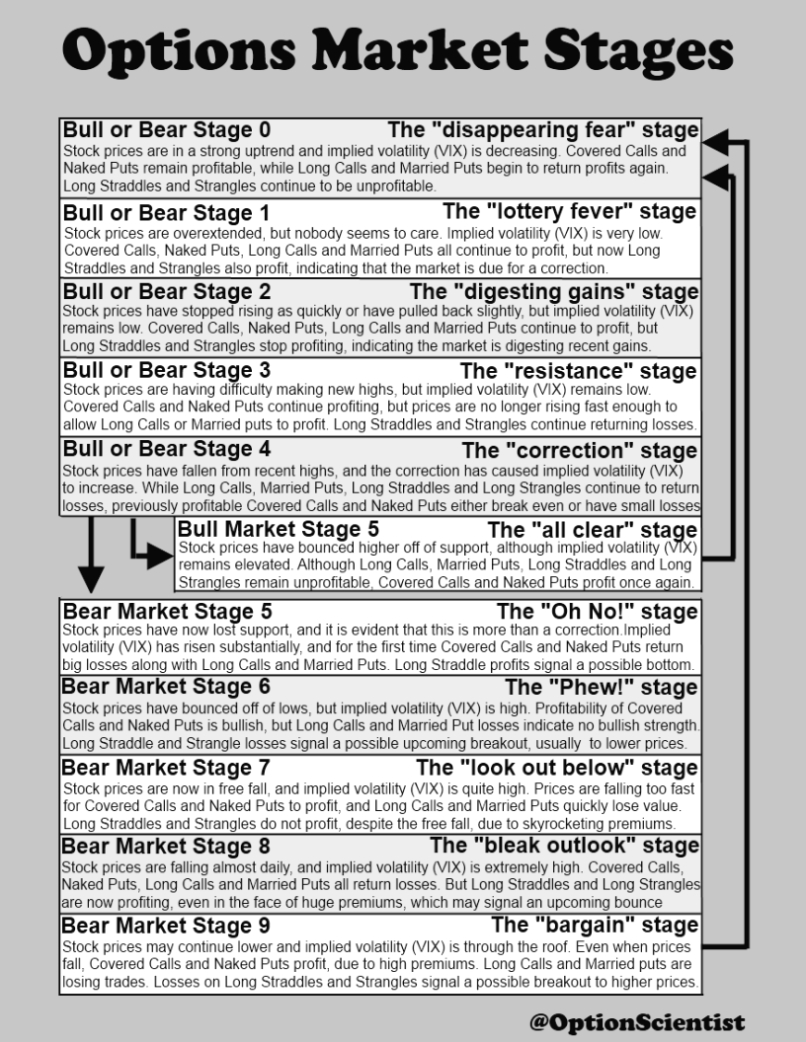
You are here – Bull Market Stage 3 – the “Resistance” stage.
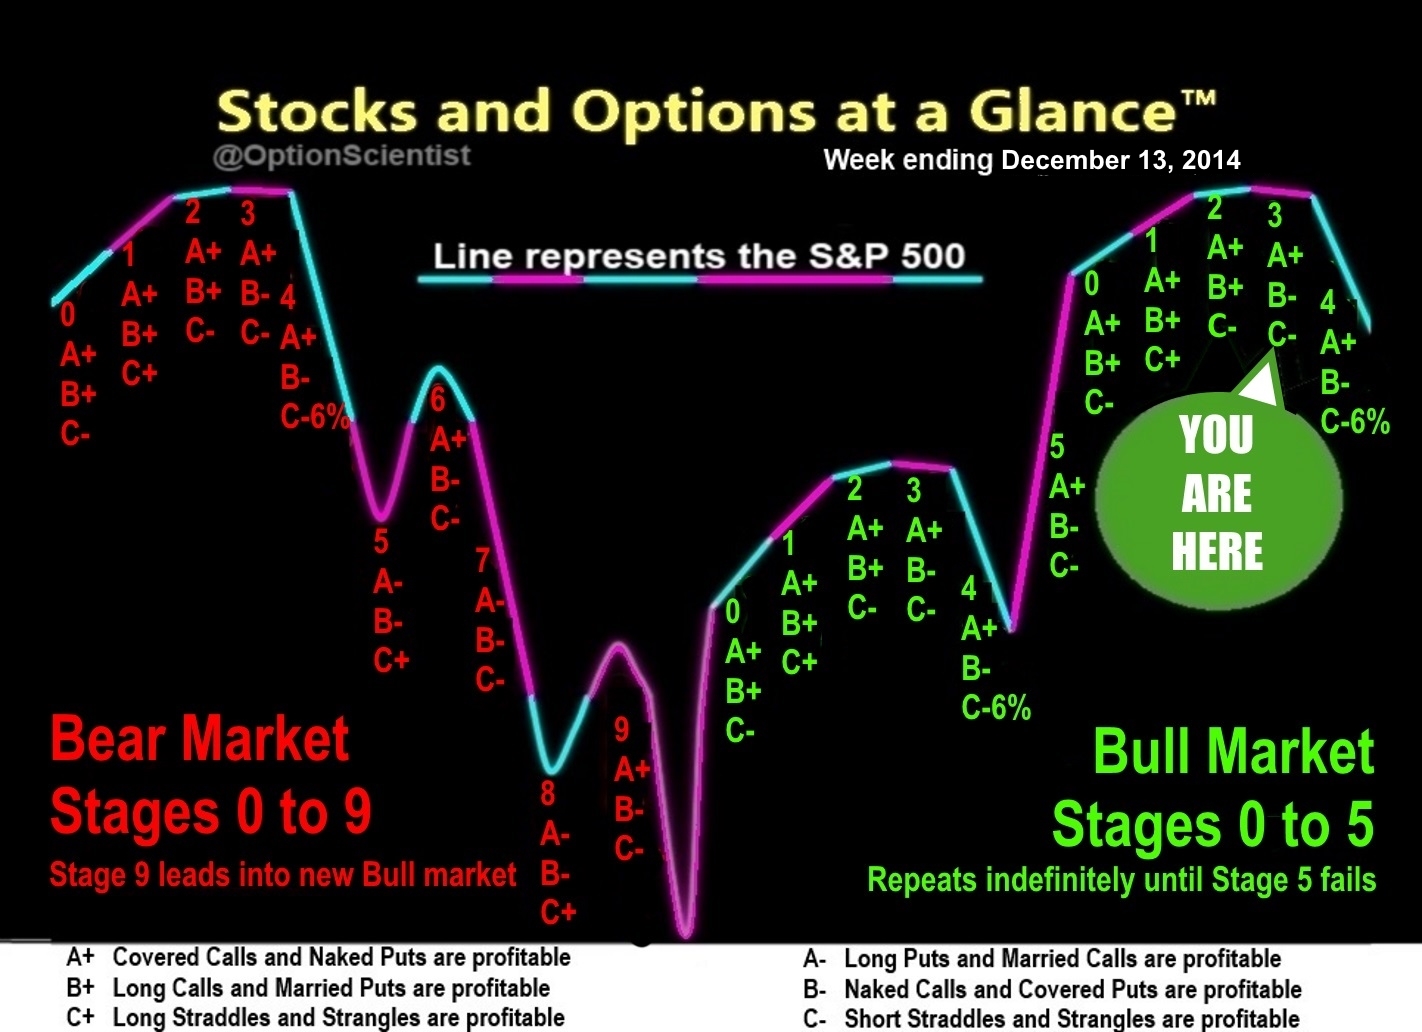
On the chart above there are 3 categories of option trades: A, B and C. For this past week, ending December 13, 2014, this is how the trades performed on the S&P 500 index ($SPY or $SPX):
- Covered Call and Naked Put trading are each currently profitable (A+).
This week’s profit was +2.5%. - Long Call and Married Put trading are each currently not profitable (B-).
This week’s loss was -1.8%. - Long Straddle and Strangle trading is currently not profitable (C-).
This week’s loss was -4.4%.
Click on chart to enlarge
The combination A+ B- C- occurs whenever the stock market is at Bull Market Stage 3, the “Resistance” stage, which gets its name from the tendency of stock prices to hit a brick wall of resistance, at least temporarily for a few weeks, if prices approach recent highs after rallying off their current lows. Resistance is not necessarily permanent, though it can be, but often occurs as traders exit previously-losing trades when those trades return to break-even, thus supplying too many shares for the market to absorb without at least a temporary pullback or consolidation in prices. Only with an outside force – an overwhelming demand for shares that overshadows the supply- can the herd be steered through the brick wall and beyond it.
The following weekly 10-minute 3-step process provides further analysis.
Weekly 3-Step Options Analysis:
On the chart of “Stocks and Options at a Glance”, option strategies are broken down into 3 basic categories: A, B and C. Following is a detailed 3-step analysis of the performance of each of those categories.
STEP 1: Are the Bulls in Control of the Market?
The performance of Covered Calls and Naked Puts (Category A+ trades) reveals whether the Bulls are in control. The Covered Call/Naked Put Index (#CCNPI) measures the performance of these trades on the S&P 500 when opened at-the-money over several time frames.
Most important is the profitability of these trades opened 112 days prior to expiration, which balances sluggish responses of longer expirations with irrelevant noisy responses of shorter expirations.
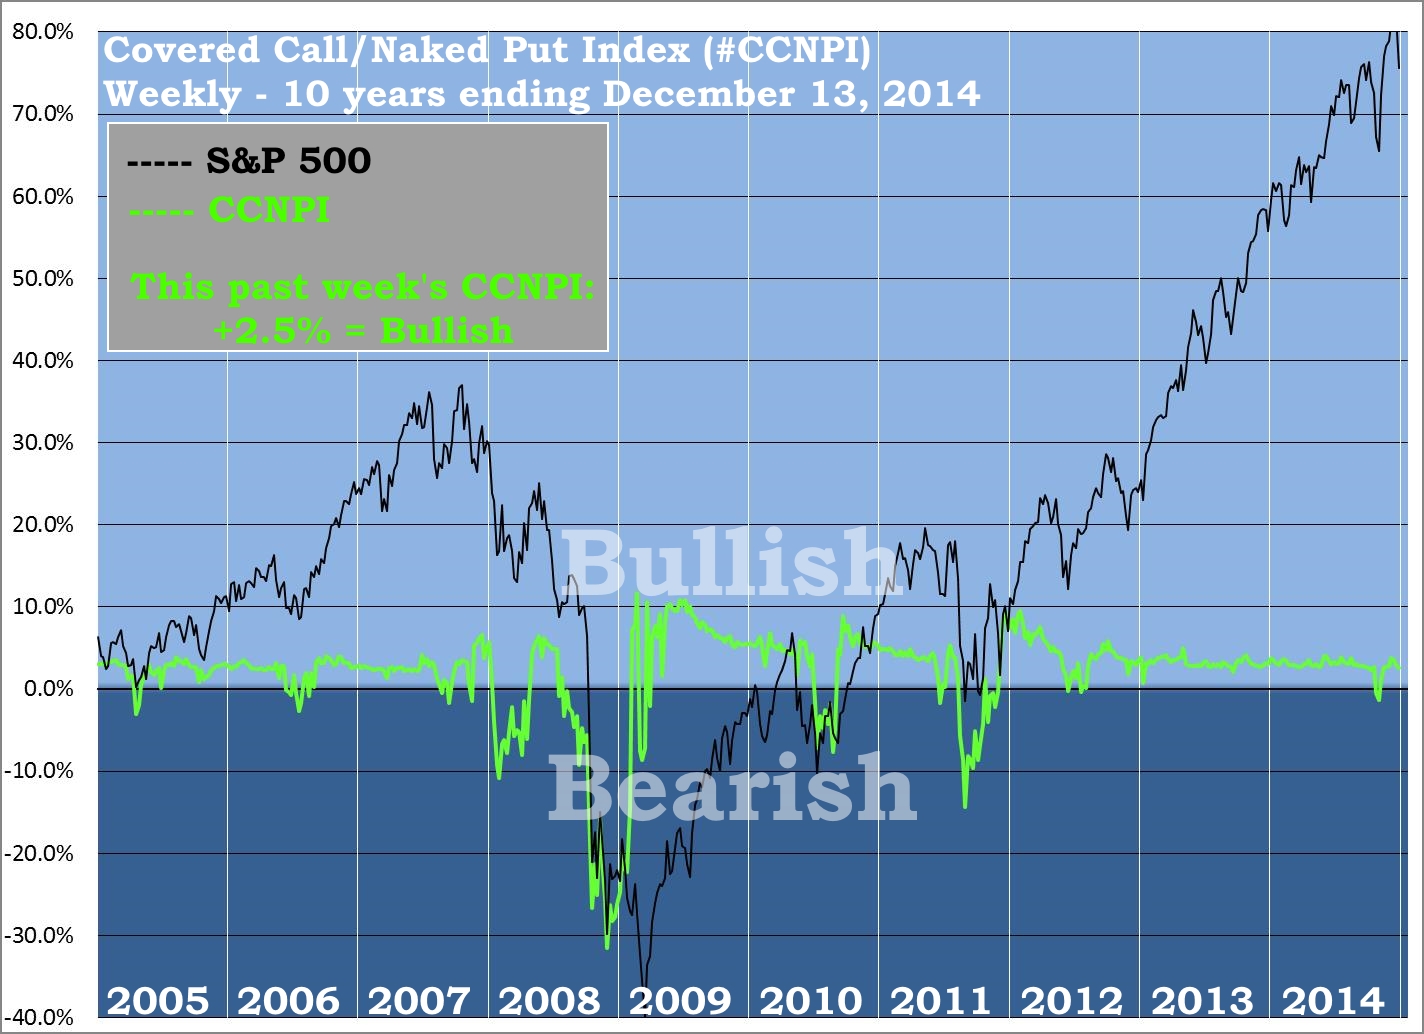
Historically, any time Covered Call trading has become unprofitable, a full-fledged Bear market has ensued within a few weeks to, at most, a few months. That makes the recent October dip into unprofitability, the first such instance in 3 years for Covered Calls, a major signal for the potential of an upcoming Bear market. As bullish as the current market may appear, traders should be open to the possibility that a Bear market is certainly not impossible.
The unprofitability of Covered Call trading does not guarantee that a Bear market will occur soon, nor does it imply that stock prices cannot rally much higher in coming weeks. Rather, it indicates that similar conditions as currently exist have always resulted in Bear markets in the past. Traders should be prepared for the possibility that the most recent rally was a trap. Even if it turns out not to be a trap, it is better to be safe than sorry.
If the S&P falls below 1950 over the upcoming week, Covered Call trading (and Naked Put trading) will become un-profitable, indicating that the Bears have regained control of the longer-term trend. Above S&P 1950 this week, Covered Calls and Naked Puts would be profitable, which is normally a sign that the Bulls are in control. However, such control is usually only temporary as long as the Bulls lack strength and confidence.
The reasoning goes as follows:
- “If I can sell an at-the-money Covered Call or a Naked Put and make a profit, then prices have either been going up, or have not fallen significantly.” Either way, it’s a Bull market.
- “If I can’t collect enough of a premium on a Covered Call or Naked Put to earn a profit, it means prices are falling too fast. If implied volatility increases, as measured by indicators such as the VIX, the premiums I collect will increase as well. If the higher premiums are insufficient to offset my losses, the Bulls have lost control.” It’s a Bear market.
- “If stock prices have been falling long enough to have caused extremely high implied volatility, as measured by indicators such as the VIX, and I can collect enough of a premium on a Covered Call or Naked Put to earn a profit even when stock prices fall drastically, the Bears have lost control.” It’s probably very near the end of a Bear market.
STEP 2: How Strong are the Bulls?
The performance of Long Calls and Married Puts (Category B+ trades) reveals whether bullish traders’ confidence is strong or weak. The Long Call/Married Put Index (#LCMPI) measures the performance of these trades on the S&P 500 when opened at-the-money over several time frames.
Most important is the profitability of these trades opened 112 days prior to expiration which balances sluggish responses of longer expirations with irrelevant noisy responses of shorter expirations.
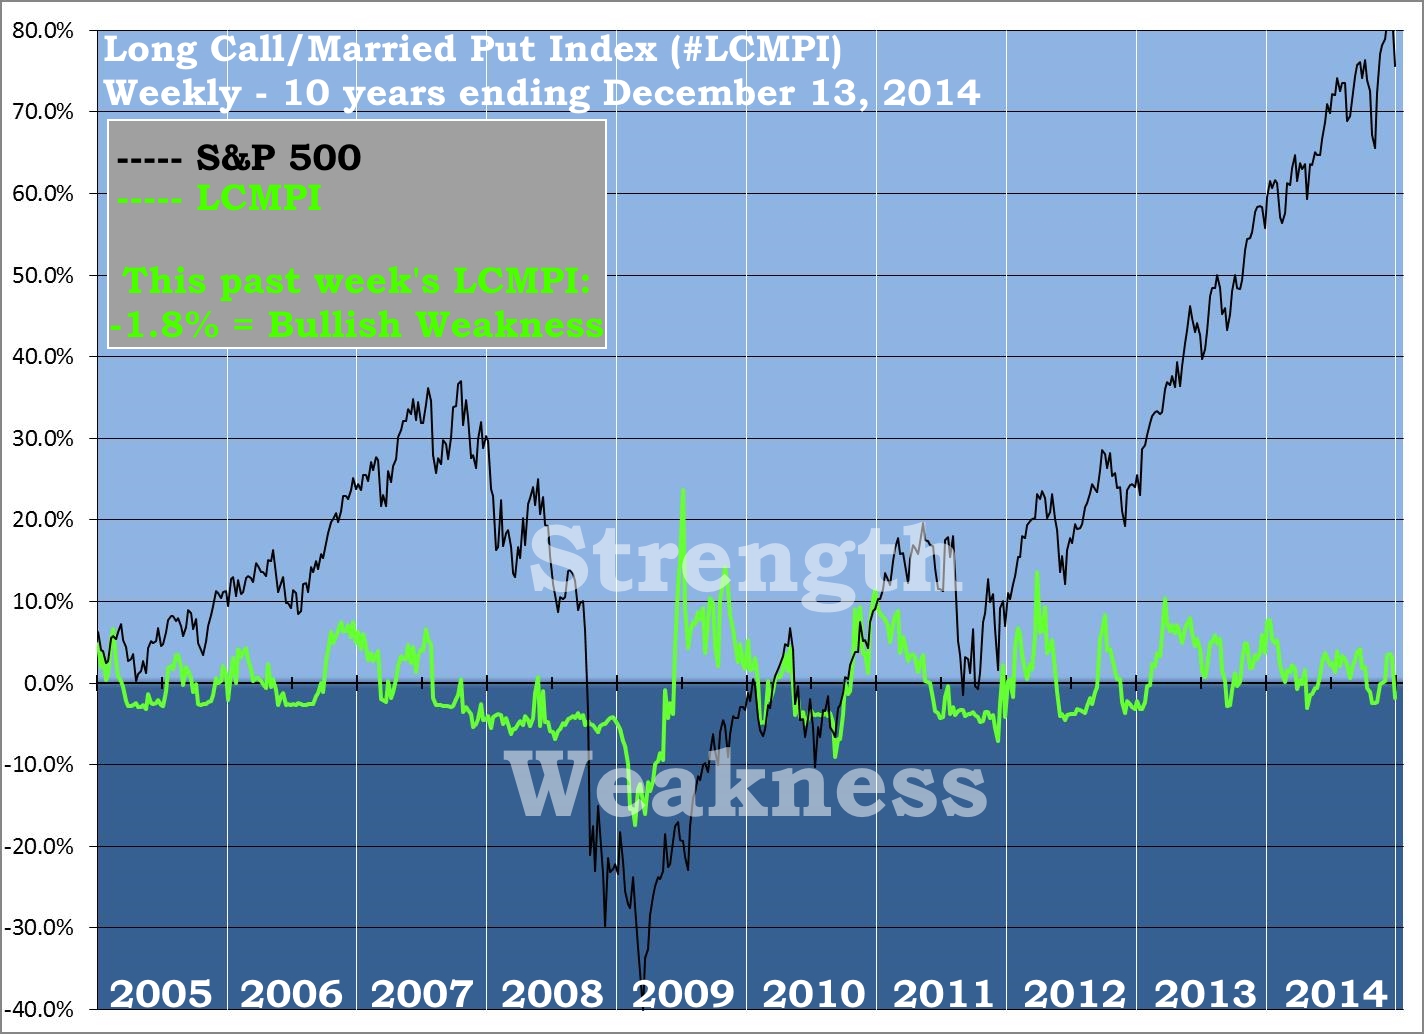
Profits from Long Call trading returned several weeks ago, a major signal of a return to bullish confidence and strength. Bear markets, even during the strongest bounces, have historically never been strong enough to cause Long Calls to profit. The current presence of Long Call losses signals a serious lack of confidence and strength among bullish traders.
If the S&P manages to close the upcoming week above 2057, Long Calls (and Married Puts) will regain profitability, suggesting the Bulls have regained confidence and strength. Levels above 2057 would suggest a significant shift in sentiment, notably a huge return of confidence by the Bulls. Below 2057 weakness and a lack of confidence should be apparent.
Confidence and strength show up as a “buy the dip” mentality, while a lack of confidence and strength produces a “sell the rip” sentiment that tends to create brick-wall resistance, since each high is perceived as a rip to be sold. In a true Bear market, the Bulls will never be confident and strong; thus, Long Calls and Married Puts will never profit during a Bear market. Profits are therefore compelling evidence that the Bulls are firmly in control.
The reasoning goes as follows:
- “If I can pay the premium on an at-the-money Long Call or a Married Put and still manage to earn a profit, then prices have been going up – and going up quickly.” The Bulls are not just in control, they are also showing their strength.
- “If I pay the premium on a Long Call or a Married Put and fail to earn a profit, then prices have either gone down, or have not risen significantly.” Either way, if the Bulls are in control they are not showing their strength.
STEP 3: Have the Bulls or Bears Overstepped their Authority?
The performance of Long Straddles and Strangles (Category C+ trades) reveals whether traders feel the market is normal, has come too far and needs to correct, or has not moved far enough and needs to break out of its current range. The Long Straddle/Strangle Index (#LSSI) measures the performance of these trades on the S&P 500 when opened at-the-money over several time frames.
Most important is the profitability of these trades opened 112 days prior to expiration, which balances sluggish responses of longer expirations with irrelevant noisy responses of shorter expirations.
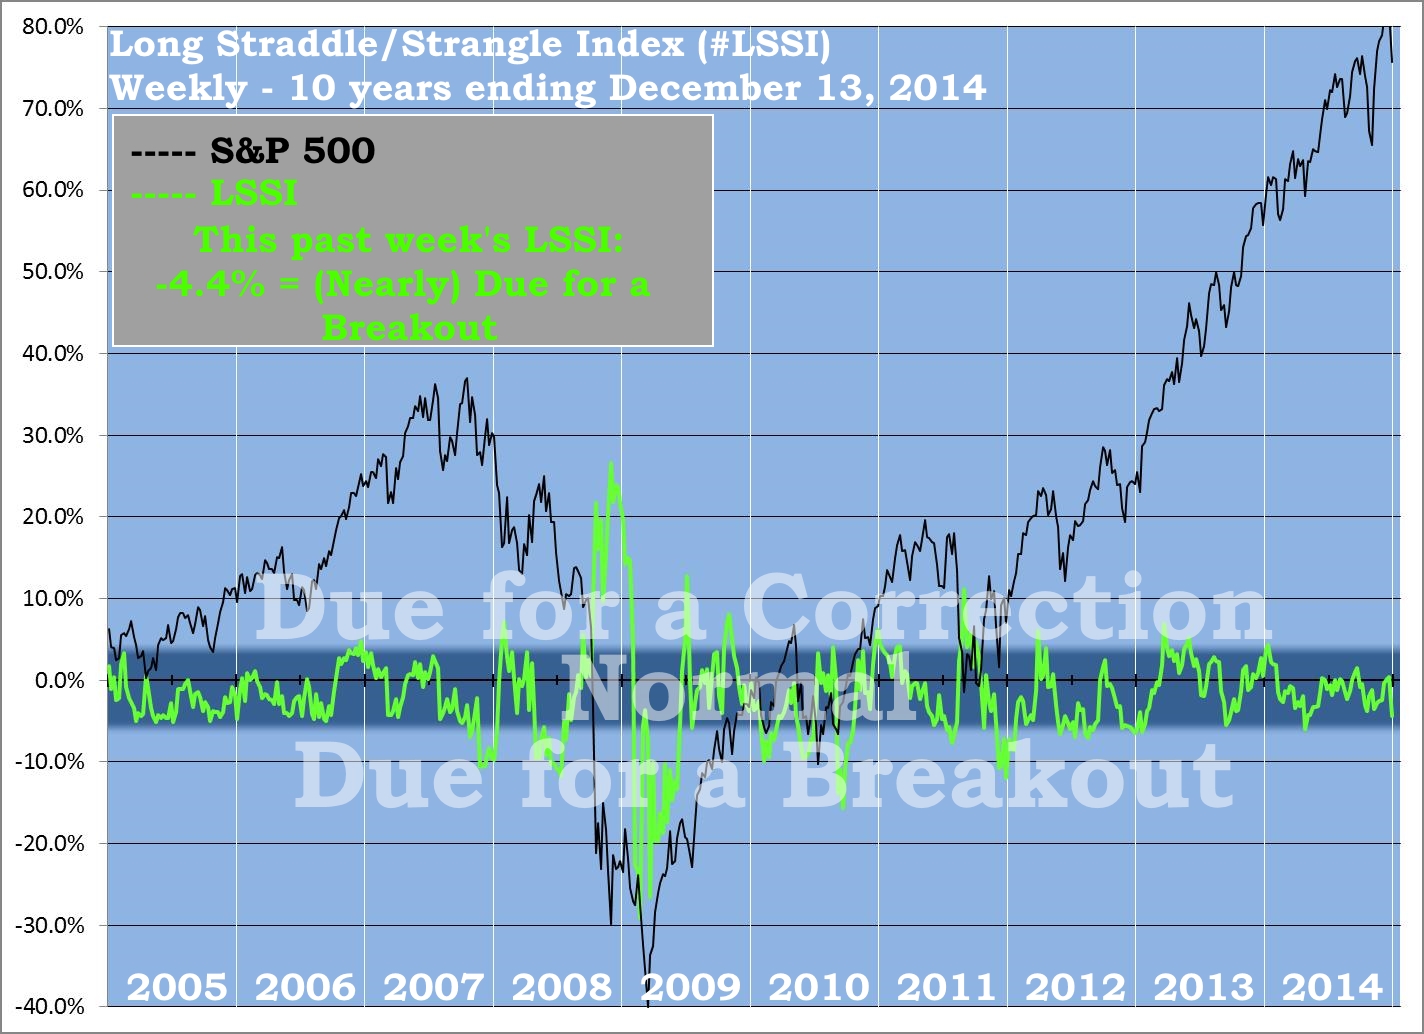
The LSSI currently stands at -4.4%, which is normal but approaching a level of concern, as it is indicative of a market that has become range-bound which tends to demand a breakout in prices from the range of the past several months. A breakout can always occur for other reasons, for example surprising economic news, but a breakout is now becoming more likely to occur for no reason at all other than the fact that traders have become anxious due to several months of range-bound stock prices. Negative values for the LSSI represent profits for Long Straddle option trades. Small losses are quite common when a Bull market is consolidating. Large losses only occur when stock prices have become unsustainably rangebound, usually preceding a major price breakout.
The 3 unusual conditions for a Long Straddle or Long Strangle trade are:
- Any profit
- Excessive profit (>4% per 4 months)
- Excessive loss (>6% per 4 months)
Long Straddle trading (and Long Strangle trading) will become profitable during the upcoming week only if the S&P closes above 2110. Values above S&P 2110 could only occur during an irrationally exuberant Bull market. Values above 2110 would therefore suggest the presence of an overbought market, but sustainably overbought.
Excessive Long Straddle trading profits (more than 4%) will not occur unless the S&P either exceeds 2191 this week. Values above 2191 can only occur in a roaring Bull market, but would suggest that stock prices have risen too far too fast for the rate to be sustainable, thus needing to correct lower, at least temporarily, in order to return to sustainability for the uptrend.
Excessive Long Straddle losses (more than 6%) will not occur unless the S&P moves to very near 1990 this week. Since excessive losses tend to coincide with a desire for traders to make stock prices break out, either higher or lower than the boundaries of their recent range, a level of the S&P near 1990 would likely bring a violent snap-back rally or else a violent resumption of the most recent downtrend.
The reasoning goes as follows:
- “If I can pay the premium, not just on an at-the-money Call, but also on an at-the-money Put and still manage to earn a profit, then prices have not just been moving quickly, but at a rate that is surprisingly fast.” Profits warrant concern that a Bull market may be becoming over-bought or a Bear market may be becoming over-sold, but generally profits of less than 4% do not indicate an immediate threat of a correction.
- “If I can pay both premiums and earn a profit of more than 4%, then the pace of the trend has been ridiculous and unsustainable.” No matter how much strength the Bulls or Bears have, they have pushed the market too far, too fast, and it needs to correct, at least temporarily.
- “If I pay both premiums and suffer a loss of more than 6%, then the market has become remarkably trendless and range bound.” The stalemate between the Bulls and Bears has gone on far too long, and the market needs to break out of its current price range, either to a higher range or a lower one.
*Option position returns are extrapolated from historical data deemed reliable, but which cannot be guaranteed accurate. Not all strike prices and expiration dates may be available for trading, so actual returns may differ slightly from those calculated above.
The preceding is a post by Christopher Ebert, co-author of the popular option trading book “Show Me Your Options!” He uses his engineering background to mix and match options as a means of preserving portfolio wealth while outpacing inflation. Questions about constructing a specific option trade, or option trading in general, may be entered in the comment section below, or emailed to OptionScientist@zentrader.ca